CHARTrunner Lean / SQC Pack® vs QI Macros® Comparison
Trying to Decide Between CHARTrunner Lean / SQC Pack and QI Macros?
Many customers are trying to decide if they should choose the QI Macros or CHARTrunner Lean / SQC Pack®, but that should be a no-brainer. CHARTrunner Lean / SQC Pack® costs a lot more and does a lot less.
- SPC Software Comparison Table (PDF, 304 KB)
Big Differences |
CHARTrunner Lean® / SQC Pack® |
QI Macros® |
Price |
$1,290 + $395/yr maintenance |
$379 USD |
User Interface / Ease of Use: |
Fill in a form technology |
Point-and-click technology. |
Learning Curve |
Days |
Minutes |
Application |
Stand Alone you have to "retrieve" data from Excel or Other Data Sources |
Excel Add-in, which means you can work on your data directly in Excel. |
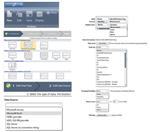
Data and Chart Selection Most users have data BUT don't know which chart to use.
|
CHARTrunner Lean / SQC Pack®
Chart Then Data: |
QI Macros
Data then Chart: |
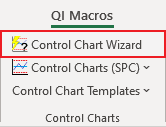
QI Macros Wizards to Do Much of the Work for You |
||
|
CHARTrunner Lean / SQC Pack® |
QI Macros® |
Control Chart Wizard |
N |
Y |
Pivot Table Wizard |
N |
Y |
| Statistical Wizard runs all of the appropriate statistical tests for your data and interprets the results |
N |
Y |
Statistical Process Control (SPC Charts) |
||
|
CHARTrunner Lean / SQC Pack® |
QI Macros |
| Variable Control Charts: Individuals, Moving Range, XmR, Xbar-R, XBar-S | Y |
Y |
| Capability Suite - Six Charts in One: X Chart, Range Chart, Histogram, Probability, Capability Plot, Values Plot | N |
Y |
| Median Control Charts | N |
Y |
| Levey Jennings Control Charts | N |
Y |
| Short Run, Cusum, EWMA and Moving Average Charts | N |
Y |
| Run Charts | Y |
Y |
| Attribute Control Charts: p, np, c, u | Y |
Y |
| Rare Events Control Charts - g chart, t chart | Y |
Y |
| Control Chart Dashboards to create multiple control charts at once | N |
Y |
| Histograms with Cp, Cpk, Pp, Ppk | Y |
Y |
| Other Variation Charts: Box and Whisker , Multi Vari, Dot Plot, Values Plot | N |
Y |
| Scatter Plot, Matrix Plot, Hotelling T2 Charts, Radar, Spider Charts | N |
Y |
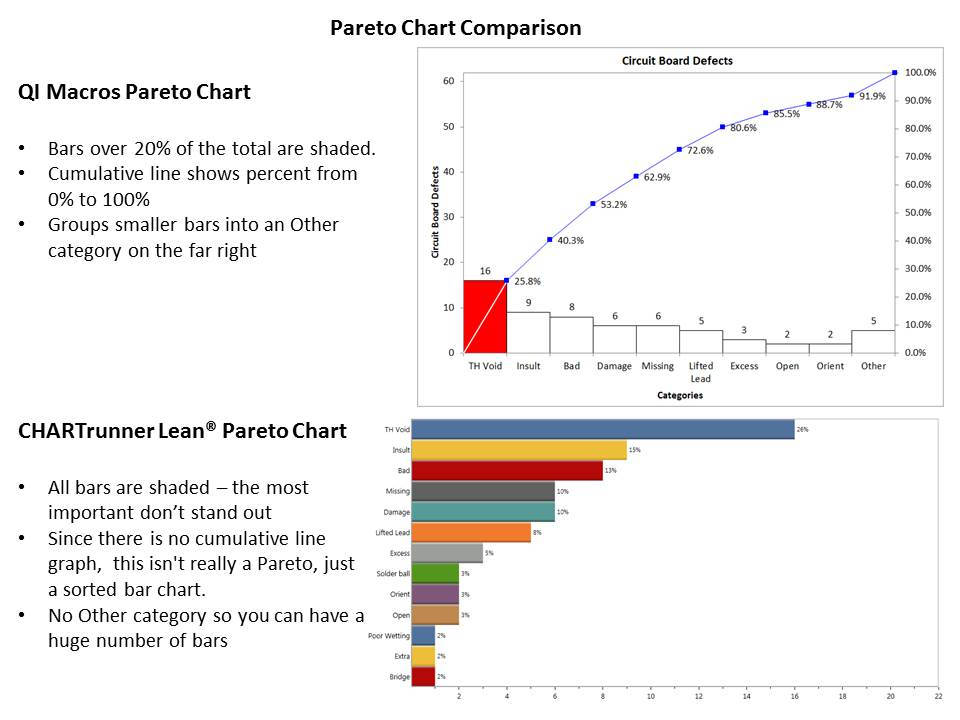
Pareto Chart |
QI Macros
|
|
| Multiple Pareto Charts at once | N |
Y |

Statistical Analysis Tools |
||
|
CHARTrunner Lean / SQC Pack® |
QI Macros |
| Test of Variances: Anova One Way, Anova Two Way Without Replication, Anova Two Way With Replication f-Test, Levene's Test |
N |
Y |
| Test of Means: t-test One Sample, t-test Two-Sample Assuming Equal Variances, t-test Two-Sample Assuming Unequal Variances, t-test Paired Two-Sample for Means, z-test Two-Sample for Means, Two One-Sided Test for Equivalence |
N |
Y |
Tests of Relationships |
N |
Y |
Non-Parametric Tests |
N |
Y |
Other Statistical Tests and Info |
N |
Y |
Fill-in-the-Blank Templates |
||
| SPC Chart Templates | N |
Y |
Lean Tools Value Stream Map, Flowchart, Lean Takt Time and NVA, Time Tracking Tool, Value-Added Flow Analysis, Yamazumi Chart |
N |
Y |
Lean Six Sigma Project Templates 8D Report (Ford), A3 Report (Toyota), Action Plan, Cost of Poor Quality Matrix, Countermeasures Matrix, Flowchart, Ishikawa Fishbone Diagram, Earned Value Management Formulas, Gantt Chart, Resource Matrix,ROI Calculator, SIPOC, Stakeholder Analysis, Voice of the Customer, Work Breakdown Structure |
N |
Y |
MSA Gage R&R, DOE, FMEA etc |
||
Measurement Systems Analysis - Gage R&R: ANOVA and XBar-R methods |
Requires purchase of Gagepack® $1,490+$395/yr maintenance |
Y |
Design of Experiments Plackett-Burman designs |
Requires purchase of DOEpack® $990+$395/yr maintenance |
Y |
Failure Modes and Effects Analysis: FMEA, PFMEA, DFMEA, MFMEA |
N |
Y |
| APQP Checklists, Control Plan, PPAP Forms, QFD House of Quality | N |
Y |
Price |
$990 + $395/yr maintenance |
$379 USD |
SQCpack® (additional) |
$990+$395 |
|
Gagepack® (additional) |
$1,490+$395 |
|
DOEpack® (additional) |
$990+$395 |
|
Mikel Harry, the guru of Six Sigma, says that the next wave of Six Sigma benefits will come from white and yellow belts saving $10-20,000 per year.
To do so, these people will need an easy-to-use tool belt for data analysis. Don't miss this opportunity.
Isn't it time you gave all of your employees the benefits of the QI Macros for Excel?
Why wait? Start creating these charts and diagrams in seconds using
QI Macros add-in for Excel.
Join 100,000+ Users
in 80 Countries


KnowWare International, Inc.
2696 S. Colorado Blvd., Ste. 555
Denver, CO 80222 USA
Toll-Free: 1-888-468-1537
Local: (303) 756-9144