Taguchi Loss Function and Capability Analysis
Good News - Bad News
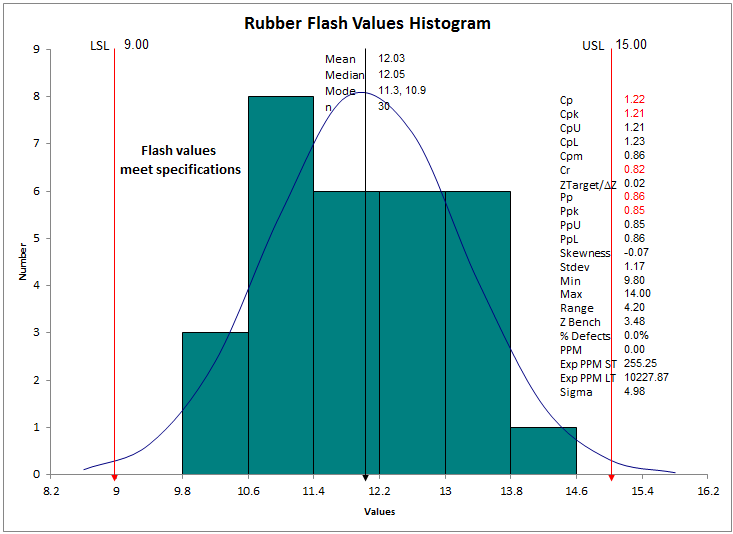
We recently sent out a QI Macros ezine about analyzing manufacturing performance data (link to rubber ezine). Many readers asked an interesting question: if my data fits between the specification limits of the histogram, but the control chart is unstable, is that good or bad?
The Good News
If your data fits between the upper and lower spec limits, then you are meeting your customer's requirements.
The Bad News
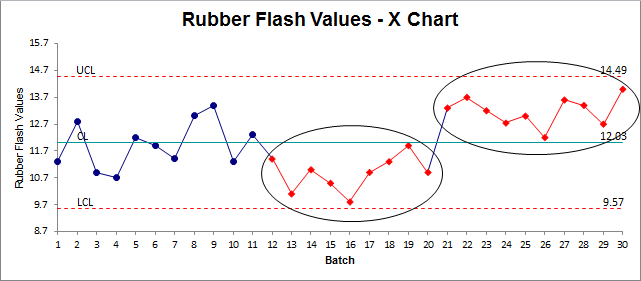
Because the control chart shows that the process is unstable (shown in red in the QI Macros), you may not be able to meet your customers requirements consistently and predictably.
In other words, you just got lucky. The process may not deliver on the customer's requirement next time. The question is: Does it matter? Taguchi wondered about this as well and did some research.
The Taguchi Loss Function
Taguchi suggests that every process have a target value and that as the product moves away from target value, there's a loss incurred by society. This loss may involve delay, waste, scrap, or rework. Look at the control chart above. Sure, the product fits within the specification limits, but as you can see, the customer might have to reset their production machines several times to accomodate the changes in specifications. Loss!
The loss isn't linear. Taguchi theorized that the loss is proportional to the square of the distance from the target value.
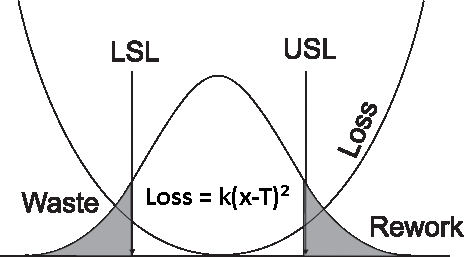
The parabolic curve describes the cost to society as the product moves away from the target value (center between LSL and USL).
Warranty Example
Many years ago I read about an example from the automotive industry. One company was building transmissions for cars in both Japan and America. The American transmissions had five times the warranty issues.
To determine the problem, five transmissions were selected at random from both the Japanese factory and the American factory. Then, they took them apart and measured all of the specifications.
- American Transmissions
- All of the American transmissions had parts that fell within the USL-LSL. Some measures were a little higher and some a little lower.
- Japanese Transmissions
- When the inspectors measured the Japanese transmissions, they got worried, because they got the same value on each of the parts on each of the five transmissions. They began to suspect that their gauges were incorrect.
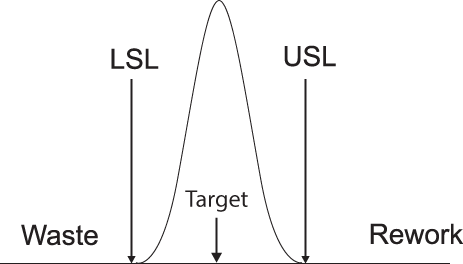
The Japanese transmissions measured identically on all of the key specifications. There was no variation to speak of. Their graph looked more like this, with the measures centered closely around the target:
Here's my point:
To truly serve your customer, your process has to be both stable and capable. It can't just be one or the other.
- Stable - the control chart is in control (no unstable conditions)
- Capable - the histogram fits inside the specification limits (USL, LSL)
Stabilize your process
When the process moves around like this example, it probably means that someone is changing the settings, without any real need to. Let the process run and then adjust the settings to move it onto the target. Then leave it alone unless it starts to drift.
Reduce Variation
Once the process is stable, use process improvement reduce the variation (adjust the process to reduce the variation from the target).
Reduce the Loss
Stabilizing your process and reducing the variation will, in turn, reduce the cost of the Taguchi Loss function. This will save you and your customers time and money (rework, waste, and delay). And customers are smart. They can tell the difference between two different transmissions and they can tell the difference in quality between you and your competitors.
Make sure you're in charge of who your customers return to year after year. Hitting the goal posts isn't good enough any more. You have to hit the target value most of the time. Your customers will love you for it.
Rights to reprint this article in company periodicals is freely given with the inclusion of the following tag line: "© 2008 Jay Arthur, the KnowWare® Man, (888) 468-1537, support@qimacros.com."
 Take our FREE Lean Six Sigma Yellow Belt training online.
Join 100,000+ Users
in 80 Countries

