Need to Conduct Lost Time Analysis?
QI Macros Pareto Charts Can Help Reduce Lost Time
In any manufacturing or service environment, production can stop for a variety of reasons: machine outage, tooling change, preventive maintenance, safety, etc. Reducing "lost time" can increase throughput and reduce costs. How can the QI Macros help companies eliminate "lost time"? By the use of Pareto Analysis.
Use Pareto Charts to Analyze Categories of Lost Time
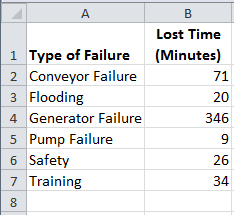
By tracking the amount of time lost or the number of outages, you can get a handle on what's causing lost time and initiate improvement projects to prevent it:
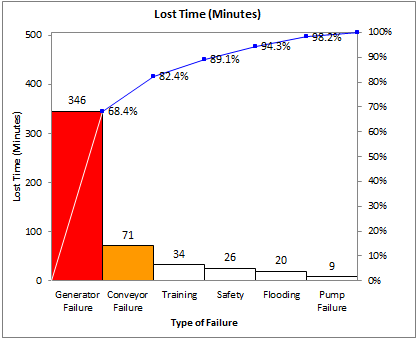
In the first example, Generator Failure is the biggest contributor. Put this in the head of a fishbone diagram and get workers together to figure out why and figure out how to make the generator work without failure.
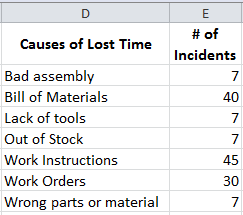
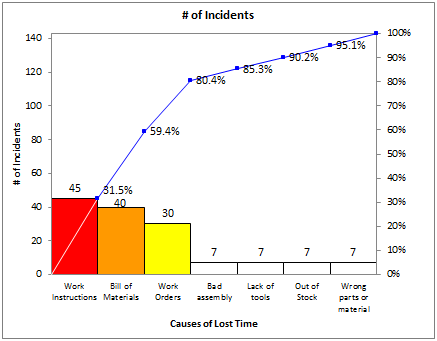
In the second example, work instructions, bill of materials and work orders all contribute to the problem. Put each one in the head of a fishbone and get workers together to figure out why these are causing lost time (e.g., missing, incomplete or inaccurate information). Mistake-proof the creation and use of these documents.
A telephone company was having lost time because of service order rejects:
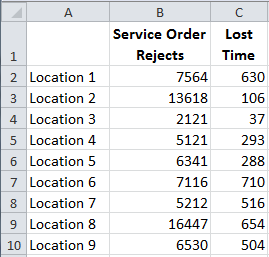
If we select A1:C10, QI Macros can create both Paretos at the same time.
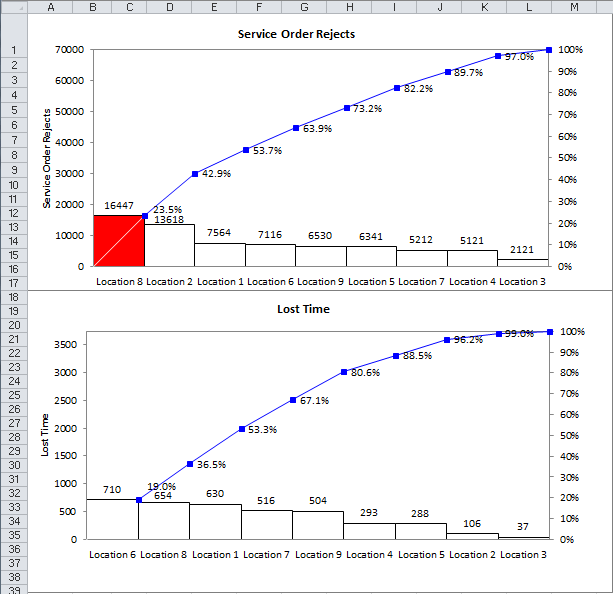
In this case, Location 8 suffers the highest incident and lost time rates. This would be the optimal place to do some root cause analysis to determine how to reduce service order rejects.
Lost Time Analysis
Lost Time Analysis (LTA) is part of Lean's tool kit and the QI Macros Pareto chart macros and Pareto Chart templates can help analyze and prevent lost time which will increase productivity and profitability.
Stop Struggling with Pareto Charts!
Start creating your Pareto Charts in just minutes.
Download a free 30-day trial. Get Pareto Charts now!
Join 100,000+ Users
in 80 Countries

