Finding the Invisible Low-Hanging Fruit
Tools that Make the Invisible - Visible
People often talk about the "low-hanging fruit" just waiting to be plucked with Six Sigma, but few seem to be able to find it. I have found that a good manager or employee can find the visible low-hanging fruit pretty easily. So most of it has already been picked. Every once in awhile, an infrequent problem or defect happens often enough to garner attention, but most of the time the big money opportunities are hiding in mountains of defect data that few know how to mine. I call this the invisible low-hanging fruit.
Over the years, I've worked on many Six Sigma projects. While I've learned hundreds of improvement tools, virtually every project was done with five tools used in a particular order. Every multi-million dollar project was accomplished with these tools in a matter of days, not months or years as some people believe is necessary. To find the invisible low-hanging fruit in your business, it is essential to learn how to mine the error data using the first tool in the improvement process—an Excel PivotTable.
Data Mining with PivotTables
If we open the "lost time" data in Documents/QI Macros Test Data/pivottable.xls (below), it's pretty obvious that we don't want to count every Generator Failure and sum the minutes of outage.
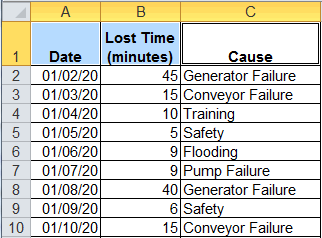
We can just select the column headings (A1:C1) and use the QI Macros PivotTable Wizard to summarize the data.
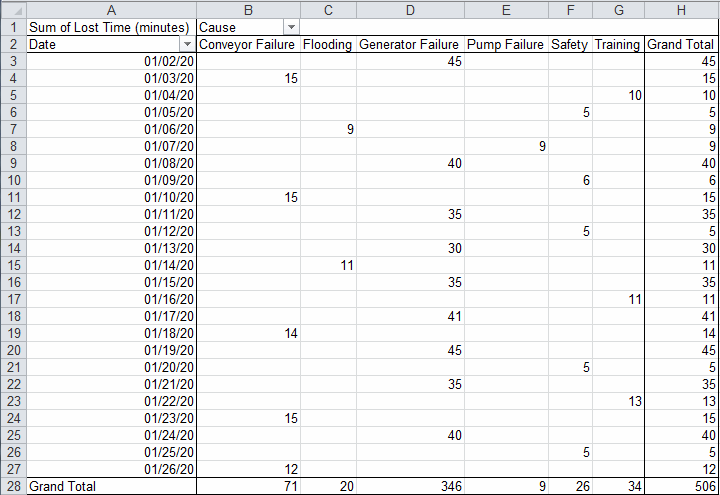
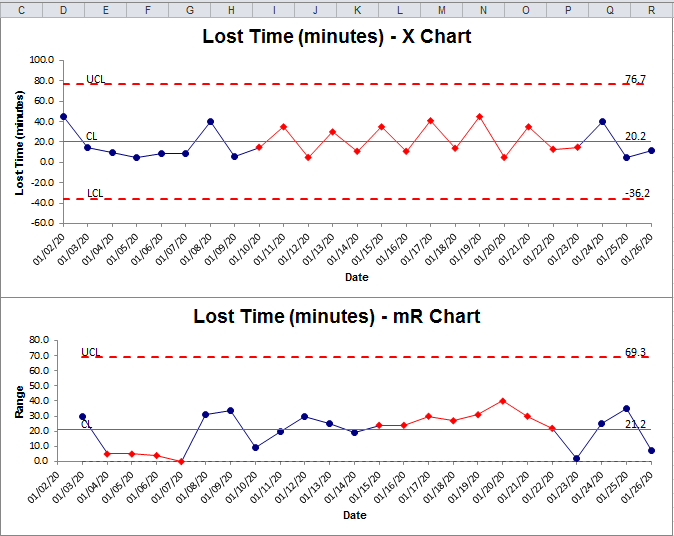
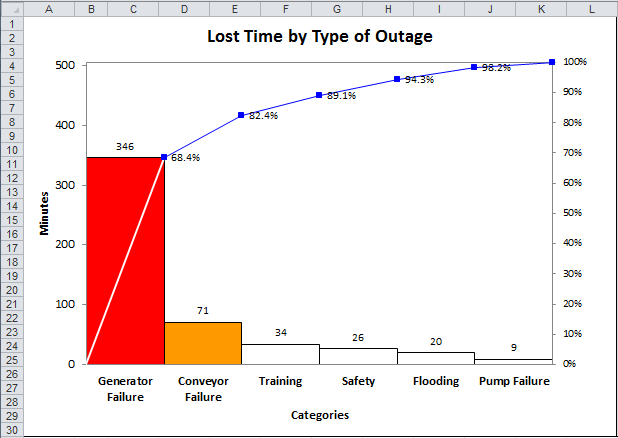
Once Excel's PivotTable has summarized the data, it's easy to create an XmR chart of lost time by day (using A3:A27 and H3:H27) and a Pareto chart of lost time by type of outage (using B2:G2 and B28:G28). The Pareto Chart shows that Generator Failure is the "big bar" and where improvement efforts should be focused. This becomes the head of the fishbone diagram. In a matter of minutes we can be ready to begin root cause analysis.
That's how easy it can be to find the invisible low-hanging fruit in any business. I've done this so often that it has become my standard approach to everything. Of course, I veer off into other tools when needed, but this will find and fix the major problems in every business from healthcare to manufacturing.
Healthcare could benefit from both clinical and operational improvement using this method. While manufacturing usually focuses on eliminating variation in finished products, there are often too many mistakes and errors in backroom functions devouring profits. Too many adjustments and credits.
Every business has a "service" side that could benefit from this methodology. And you don't have to know Six Sigma to do it. You just have to know how to use PivotTables, control charts and Pareto charts to find the invisible low-hanging fruit.
Master these tools used in this order and you'll be well on your way to creating breakthrough improvement with Six Sigma. QI Macros will support you every step of the way.
To learn more about Breakthrough Improvement with the QI Macros and Excel, get my new book (click here) and watch the supporting videos (click here).
Rights to reprint this article in company periodicals is freely given with the inclusion of the following tag line: "© 2014 Jay Arthur, the KnowWare® Man, (888) 468-1537, support@qimacros.com."
 Take our FREE Lean Six Sigma Yellow Belt training online.
Join 100,000+ Users
in 80 Countries

