Top Ten Mistakes Made on Excel Spreadsheets
The Data on Most Spreadsheets is Overcooked! Is Yours?
How you set up your data in Excel has everything to do with your ability to analyze it later. Unfortunately, most people don't know how to do this. This lesson series covers ten mistakes to avoid.
Lesson 2 of 6
Learn about the tarpits of using blank rows and columns.
Mistake Four
Blank Rows and Columns
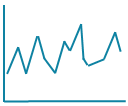
Blank rows and columns also make it much harder to select, analyze or chart your data. If you select this data and try to create a line chart, you’ll get:

Line Chart from Data
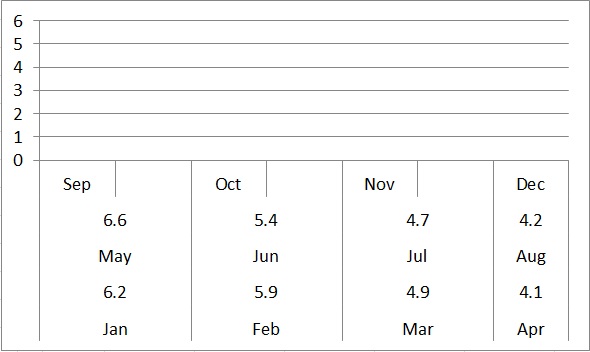
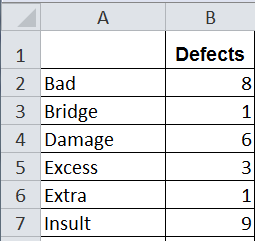
How should you organize your data? In columns with time or categories in column A and data in column B.
Time Series data

Category data
Watch your inbox for Lesson 3 where we discuss the tarpits caused by column headings.
Stop using old technology!
Upgrade Your Excel and Data Analysis Skills to Smart Charts Using QI Macros.
Track Data Over Time
Primitive Chart
Line Graph
Line Graph
Smart Chart
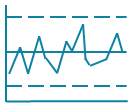
Control Chart
Control Chart
Compare Categories
Primitive Chart
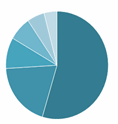
Pie Chart
Pie Chart
Smart Chart

Pareto Chart
Pareto Chart
Analyze Variation
Primitive Chart
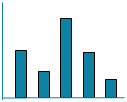
Bar or Column Chart
Bar or Column Chart
Smart Chart
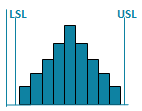
Histogram
Histogram
QI Macros add-in for Excel makes creating smart charts a snap.
Join 100,000+ Users
in 80 Countries


KnowWare International, Inc.
2696 S. Colorado Blvd., Ste. 555
Denver, CO 80222 USA
Toll-Free: 1-888-468-1537
Local: (303) 756-9144
©
1997 - 2026 KnowWare International Inc. All Rights Reserved. Legal Info | Terms of Use