Real Time SPC Gages and Interfaces
Manufacturers have to measure parts and track results to ensure that production remains consistent and trouble-free. Statistical Process Control (SPC) is an excellent method to do this. The trick is that you have to get the measurement from the gage into an SPC chart in real time.
With QI Macros, you can do real time SPC manually and mechanically.
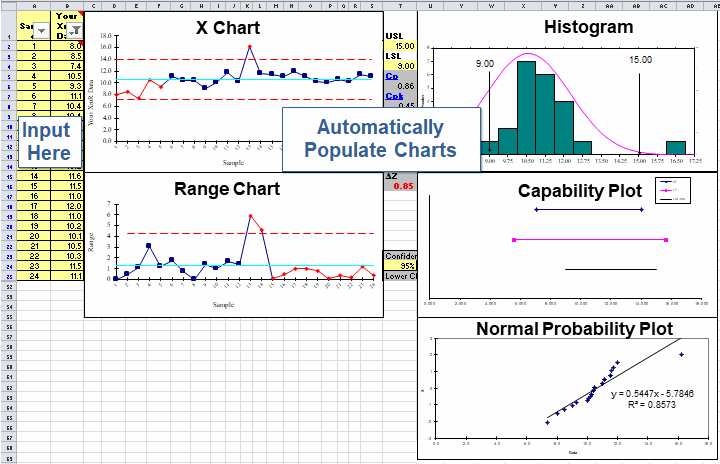
Manual input - Employees on the production floor can perform real-time SPC by inputting data directly into one of the QI Macros Lean Six Sigma-templates. They just input the data in the yellow area to the left and control charts, histograms, and probability plots are created on the right:
If your gage exports data into a comma delimited file (.csv), you can open the file with Excel and copy/paste the data into one of the QI Macros XmR, XbarR, or XbarS templates to create charts instantly. Order Now!
Automated input - If manually inputting your data becomes too cumbersome or error-prone, imagine clicking the data button on a gage and automatically transferring each measurement into a template that calculates Cp, Cpk and and draws control charts.
Gage interfaces and QI Macros (for one gage) make this easy.
Gage Interfaces
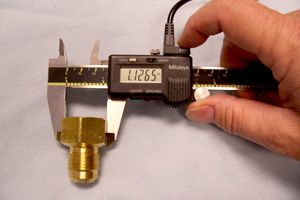
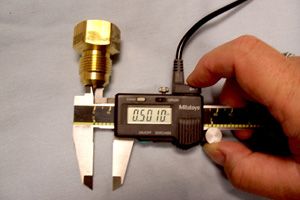
Modern gages allow for digital SPC output with the push of a button:
The gage connects to an interface via a cable or wireless modem. The interface then connects to your computer that is running Excel and QI Macros:
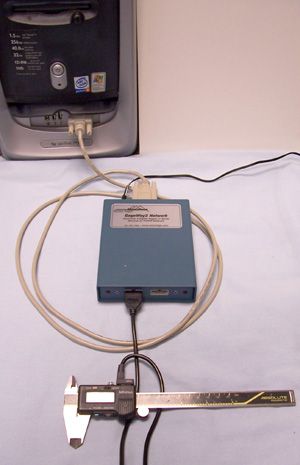
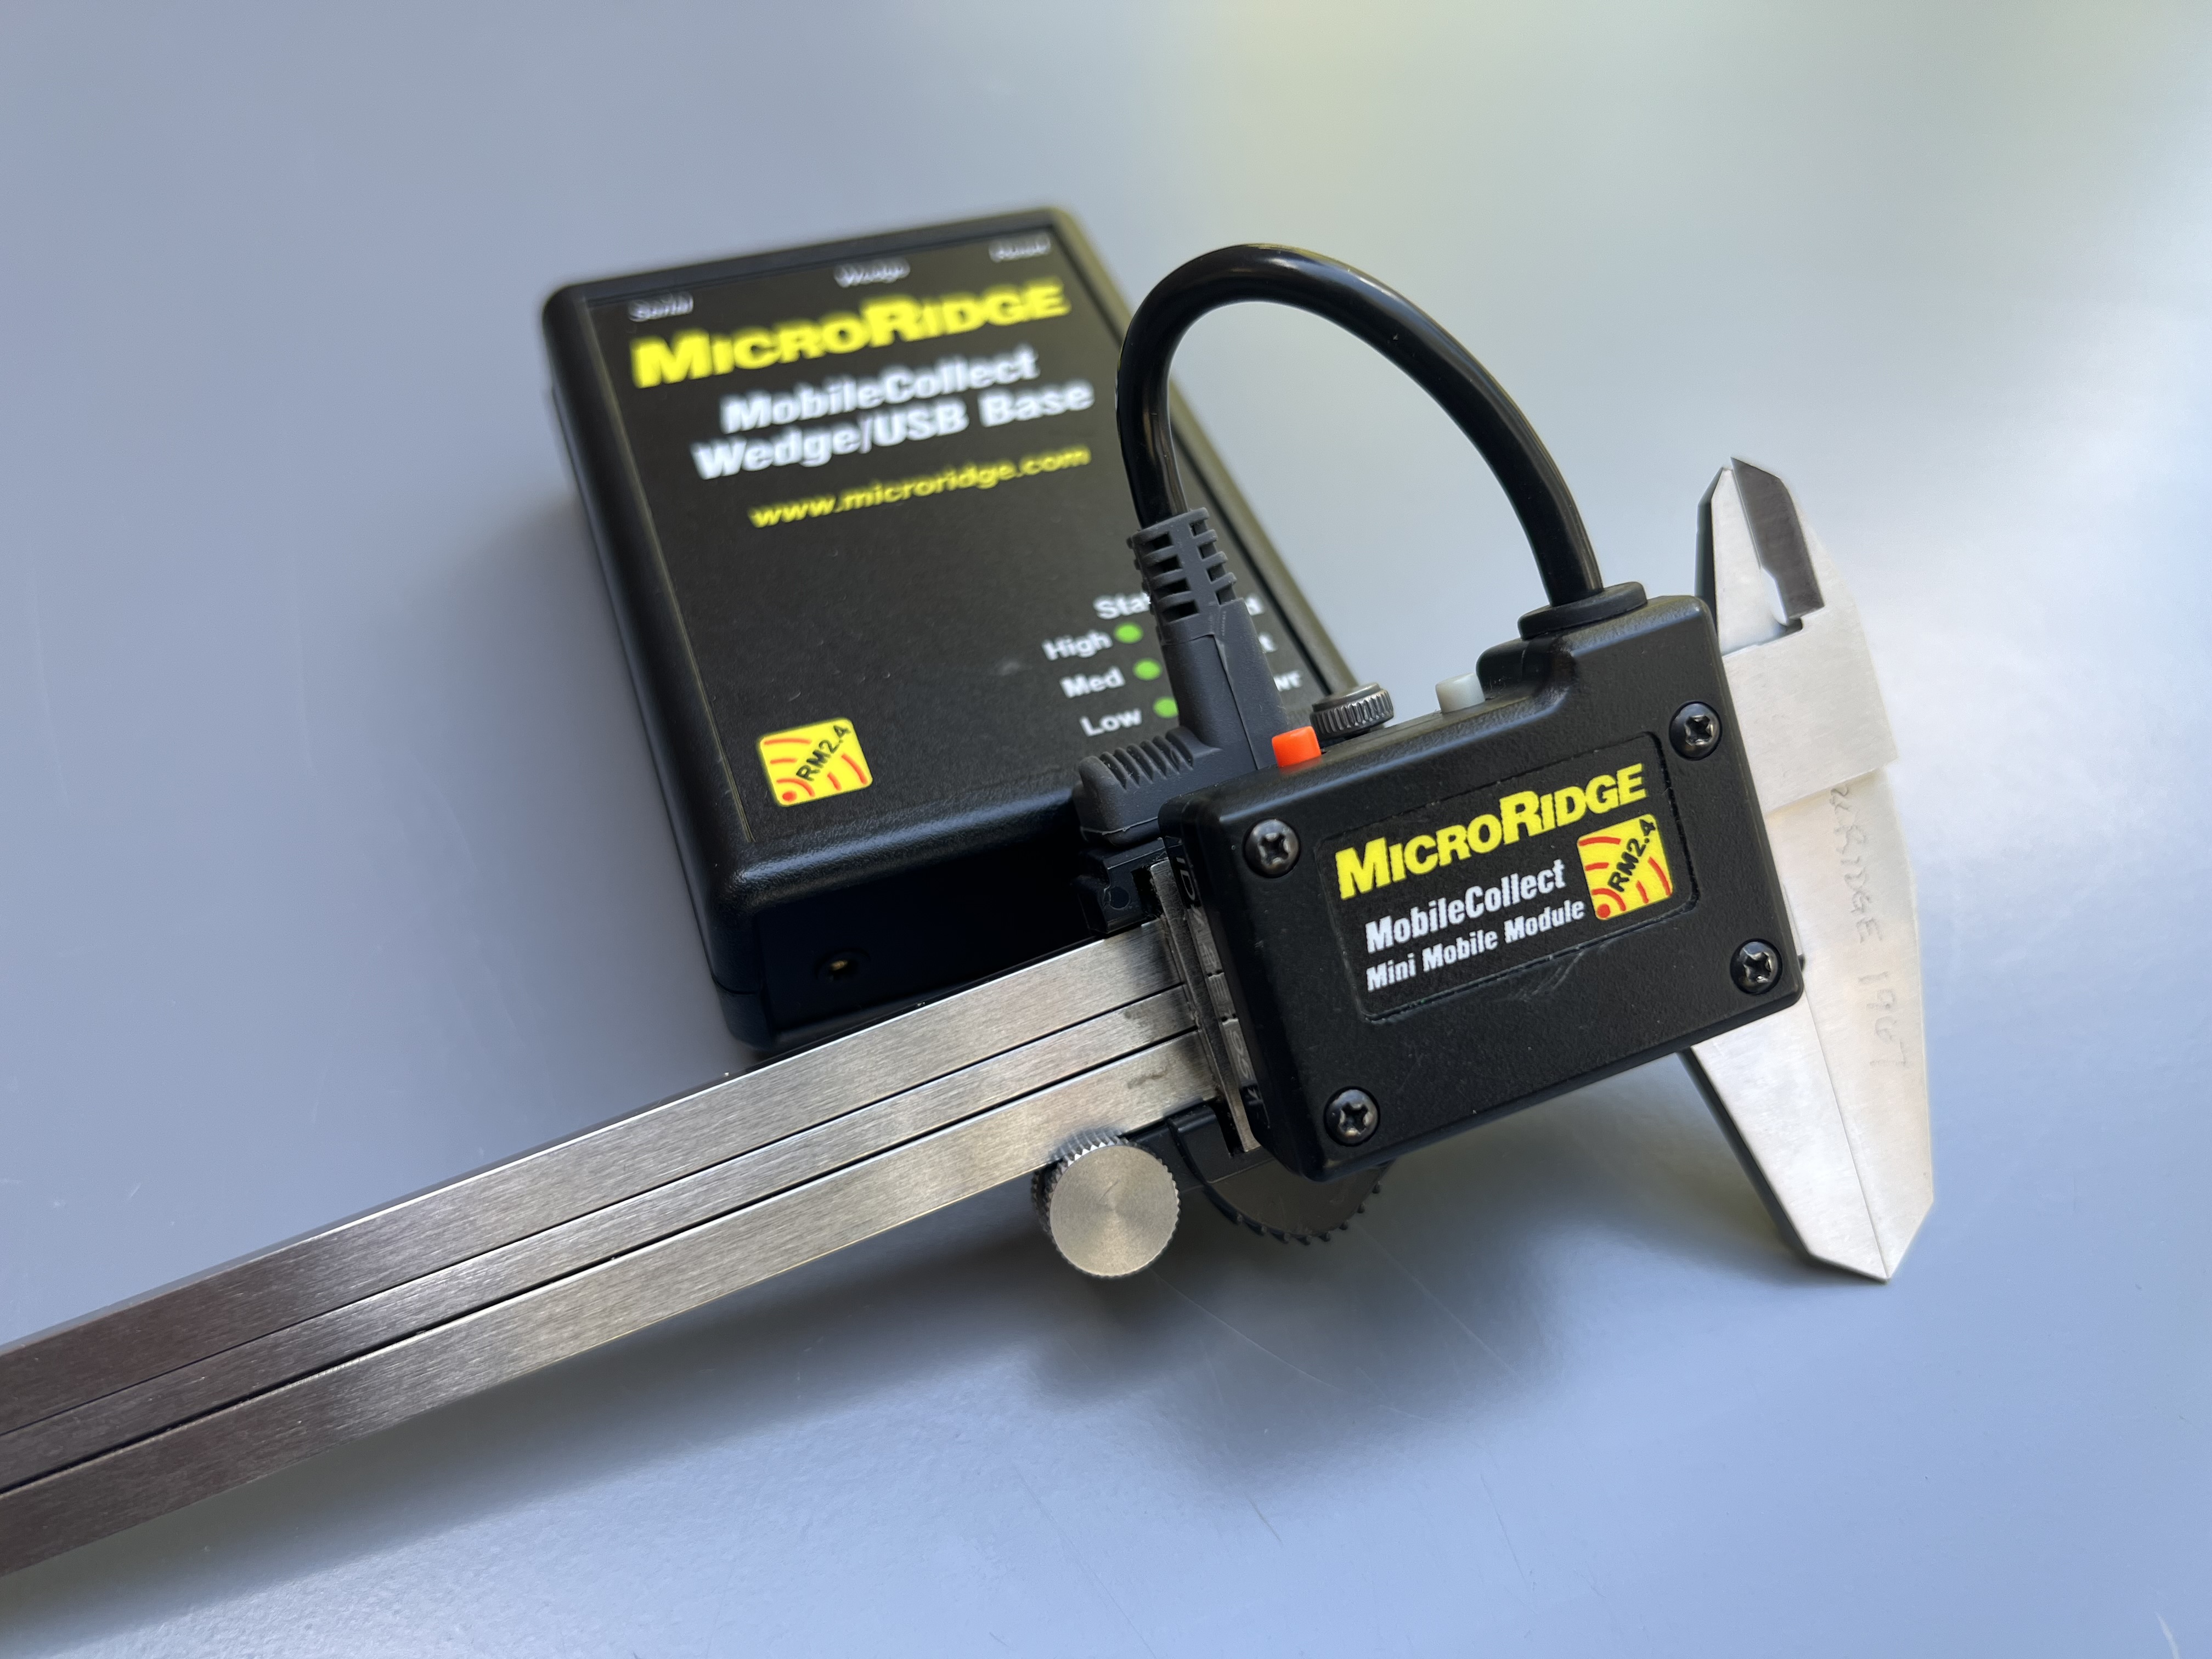
MicroRidge also offers several different wireless MobileCollect options (listed below is the Wedge/USB Base, as well as the Mini Mobile Module):
Keyboard-like Input
Software allows data coming from the gage to act like there's a typist at the keyboard. The gage name, data value, date/time stamp and so on can be transferred to an Excel spreadsheet with a single click of the gage's "data/read" button.
Using the QI Macros XmR template (for a single gage) data read from the gage can automatically populate control charts, histograms and normal probability plots in real time. Just select cell B2 and start entering data. The control charts and histograms will grow as you enter data:
Cp and Cpk values can be read directly from the worksheets. Unstable conditions can be identified directly from the control charts.
MicroRidge Hardware and Software Interfaces
Download the Real Time SPC Case Study (PDF)
Other Charts Included in QI Macros for Excel
Join 100,000+ Users
in 80 Countries

