January 2005 Brain Teaser
A Case Study
If you are looking for manufacturing case studies, a great resource is Dr. Sophronia Ward's Brain Teaser column in Quality Magazine. You can view back issues on the Quality Magazine website.
This issue of the QI Macros ezine shows you how to solve the Jan 2005 Brain Teaser using QI Macros for Excel.
Background
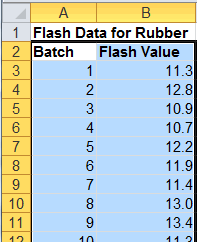
A rubber company needs to know if its product is meeting customer specifications of 12 +/-3 and if its process is stable.
To determine if the data meets specifications, use a histogram. To run a histogram using QI Macros:
- Select the data. Note: Just select the data points and not the batch numbers. Since the batch numbers are formatted as numbers, the macro will treat them as part of your data if selected.
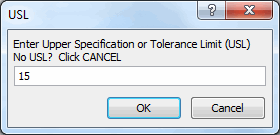
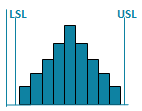
- Click on QI Macros menu and then select Histogram. The histogram macro will prompt you for the spec limits. In this case the upper spec limit is 15 (12 + 3) and the lower spec limit is 9 (12-3).
- Here is the histogram for the rubber flash values. Do the flash values meet specifications?
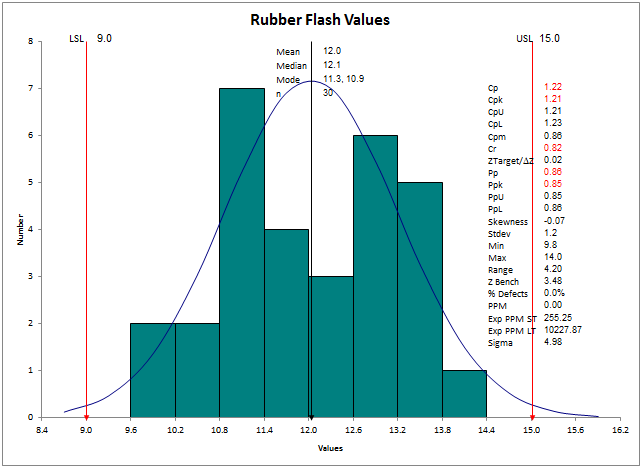
The answer is "yes" since all of the points on the histogram fall between the spec limits.
- In the case study, the production department wants spec limits of 12 +/-1(13 and 11). Rerun the histogram with these limits. Do the flash values still meet specifications?
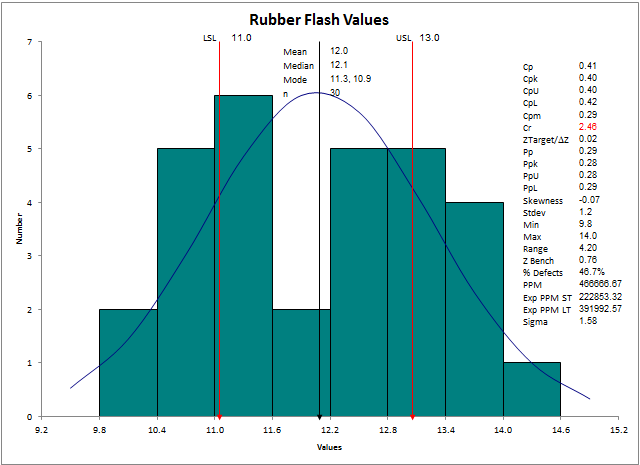
The answer is "no". A large number of the flash values fall out side of the spec limits. Also, note that the new spec limits reduce the Cp and Cpk values.
- The next question is, "Is the process predictable?" Use a control chart to determine the stability and predictability of a process.
- QI Macros control chart wizard can choose the right control chart for you. In this case, it chooses the XmR chart because this is variable data, single sample.
Here is the X and R chart for the rubber flash values. Is the process stable and predictable?
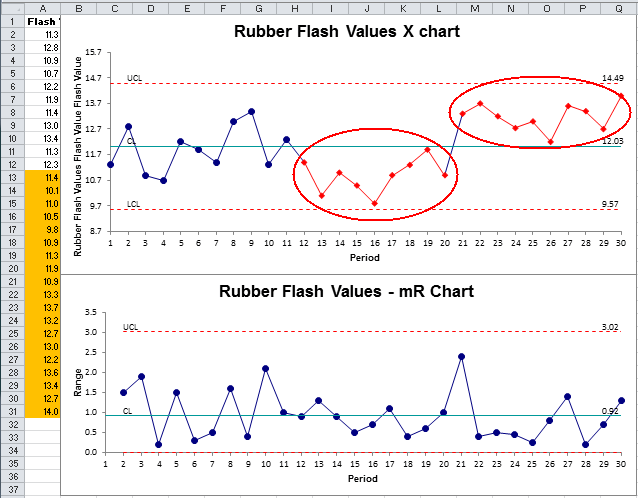
The answer is "no." QI Macros turn all unstable points or trends red. The Xchart contains two sets of unstable trends and indicates that the process is not predictable.
View further information and the answers to this case study in the Quality Magazine Feb. 2005 Brain Teaser column.
Stop using old technology!
Upgrade Your Excel and Data Analysis Skills to Smart Charts Using QI Macros.
Track Data Over Time
Primitive Chart

Line Graph
Line Graph
Smart Chart
Control Chart
Control Chart
Compare Categories
Primitive Chart
Pie Chart
Pie Chart
Smart Chart

Pareto Chart
Pareto Chart
Analyze Variation
Primitive Chart
Bar or Column Chart
Bar or Column Chart
Smart Chart
Histogram
Histogram
QI Macros add-in for Excel makes creating smart charts a snap.
Join 100,000+ Users
in 80 Countries

