Looking For a Way to Do Text Mining and Analysis in Excel?
QI Macros can summarize and analyze text for you!
To Analyze Text Tables using QI Macros:
- Select a table of text.
- Click on QI Macros menu > Data and Text Mining > Word Count Wizard.
- QI Macros will parse your text into one- and two-word phrases, and sort the counts for you.
The Challenges of Text Mining and Analysis
Text data, by its very nature, is unstructured and varies from person to person. So categorizing text becomes difficult. For example, healthcare reps can spell Medicare in various ways: MDCR, MedCR, Medicr, and so on. This variability makes text analysis more complex and challenging than plain numbers.
QI Macros Word Count Wizard will handle this quite easily. It may take awhile if there's lots of records, but it's much faster than trying to do it by hand or using Excel's COUNTIF statement. Most help desk software allows an export to Excel, so it is easy to get a text file.
Example of the Power of the Word Count Wizard
A healthcare company's service reps entered notes about why insurance claims were denied. This text data, stored in a mainframe computer, was a rich source of information about the cause of denied claims, but extracting the data was considered too difficult because there were over 35,000 individual notes about individual cases. Every note was somewhat different depending on the rep who did the analysis. Analyzing it by hand would have taken weeks. This is where text mining comes to the rescue.
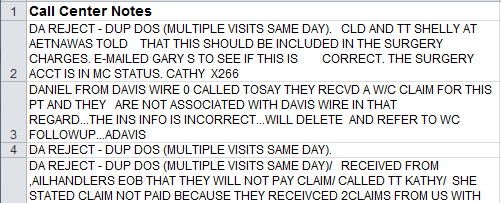
We start with a subset of 35,000 healthcare denied claims comments:
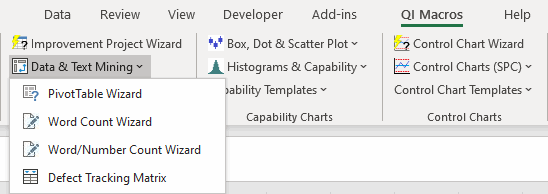
To use the Word Count tool, simply select the data then click on QI Macros Menu and choose "Word Count Wizard" from the Data & Text Mining sub menu:
The Word Count wizard will parse the selected text into words and two-word phrases, then use Excel's PivotTable to summarize the frequency of phrases and sort them in descending order:
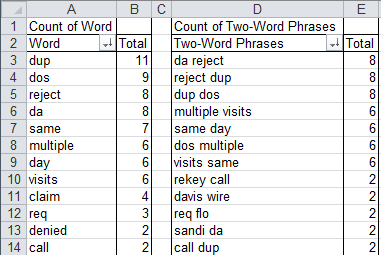
QI Macros Word Count wizard strips out common English words such as "the" or "and". What's left is a Pareto pattern.
Most common words: DUP and DOS (which stands for Date Of Service).
Most common phrases: DUP DOS, multiple visits, visits same day.
Ah Ha! Insurance companies were rejecting claims because they had an overlapping (duplicate) date of service. This led the healthcare company to examine these rejects and they discovered that the patients were admitted from the Emergency Department resulting in one claim for the ED and one for the nursing unit, rather than one claim for both. Procedures were changed and this type of denied claim vanished saving millions of dollars and endless hours of rework.
Text Mining and Root Cause Analysis
Companies use data mining to explore large amounts of data to discover meaningful patterns and rules. Text mining, a subset of data mining, explores the written word to find hidden patterns. By some estimate, stored text contains as much as 80 percent of the key information needed for business improvement. What are some sources of text data for mining?
- Service rep or help desk comments
- Customer complaints
- Transcriptions of recorded voice such as doctor's notes
- News stories
Text mining can help you find the root cause of comments, a key method for Six Sigma. The goal is to summarize the various words and phrases to see if there's a Pareto pattern (80/20) to the text data. Text mining is a powerful tool for Six Sigma and the QI Macros Word Count tool helps make it simple.
Isn't it Time to Upgrade Your Data Mining and Analysis Skills?
Stop Struggling to Analyze Your Data in Excel!
Start using QI Macros data mining tools and smart charts.
Download a free 30-day trial. You'll Look Like an Expert!
QI Macros add-in for Excel Draws These Charts Too
Join 100,000+ Users
in 80 Countries

