Watch How to Use QI Macros to Draw Charts
Described in the Six Sigma Handbook, by Pyzdek and Keller
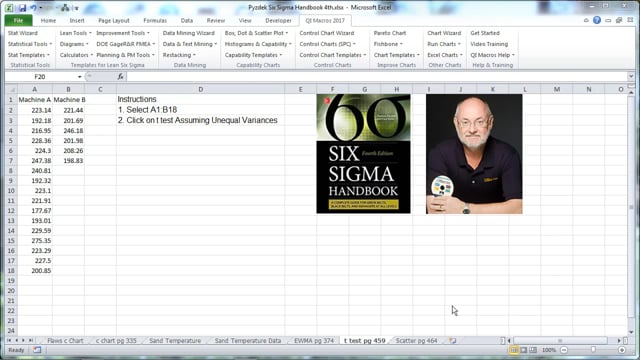
A popular book, Six Sigma Handbook, ©2014 McGraw-Hill. The book covers how to implement Six Sigma and control charts.
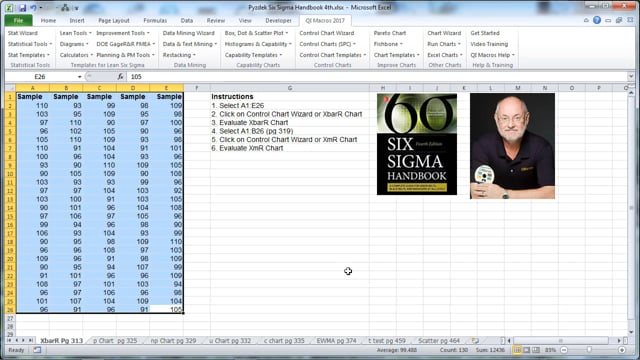
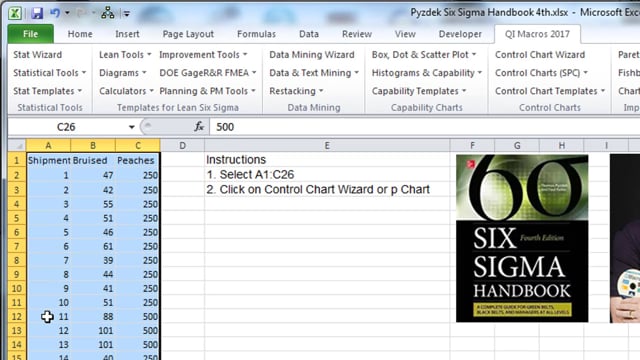
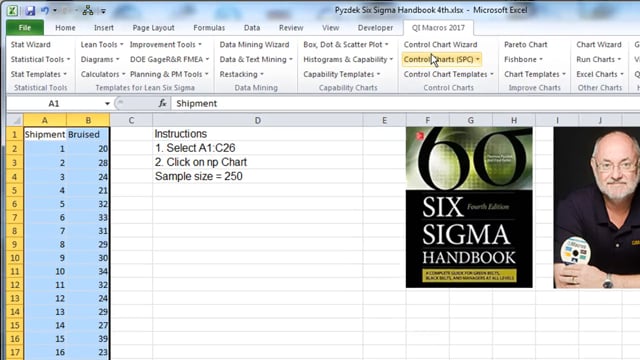
It's easy to use the QI Macros to create the run charts, p/u charts and XmR charts that feature prominently in the book. If you have installed QI Macros (purchased or trial) you already have an Excel spreadsheet containing many of the data sets described in this book. Look in: My Documents > QI Macros Test Data >Pyzdek Six Sigma Handbook.xlsx. (Also look in c:\program files]\qimacros\testdata.)
Watch the videos below to learn how to use QI Macros to create each chart. The page reference for the data used in each video is listed to the right. The book doesn't contain the data for all of the charts, but these should get you started.
| Six Sigma Handbook | Page |
|---|---|
| XbarR and XmR Chart | 313 |
| p Chart | 325 |
| np Chart | 329 |
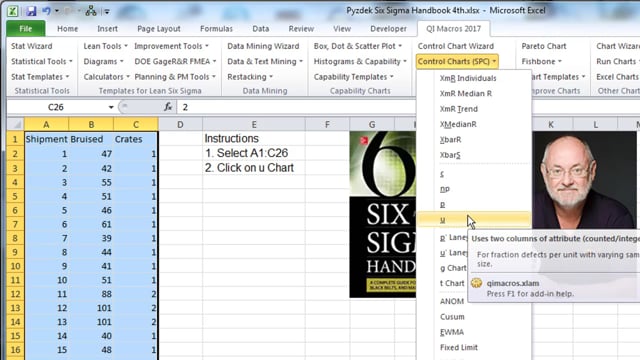
| u Chart | 332 |
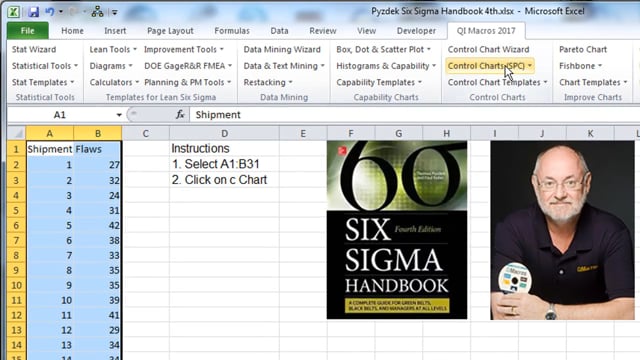
| c Chart | 335 |
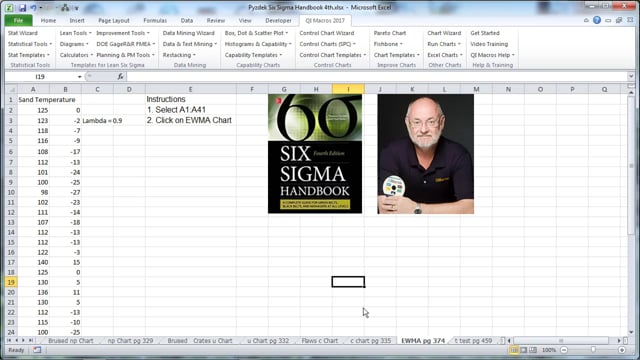
| EWMA Chart | 373 |
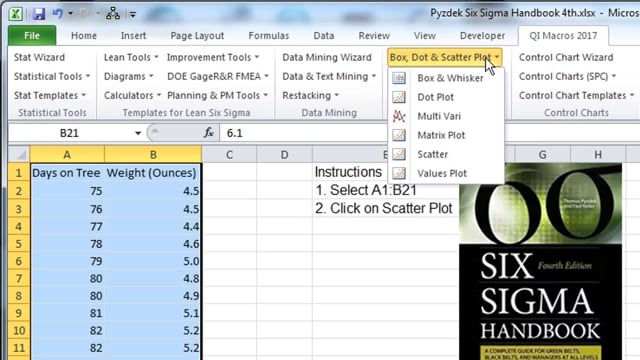
| Scatter Chart | 394 |
| t Test | 459 |
How to create XbarR and XmR Charts
How to create p chart
How to create np Chart
How to create u Chart
How to create c Chart
How to create an EWMA
How to create a Scatter Chart
How to create t Test
Why Choose QI Macros?
![]()
Faster to Learn
and Easier to Use
- Works right in Excel
- Create charts in seconds
- Easy to customize & share charts
- Free Training Anytime
![]()
Proven and Trusted
- More than 100,000 users
- In More than 80 countries
- Five Star CNET Rating - Virus free
![]()
Affordable
- Only $379 USD
Quantity Discounts Available - No annual subscription fees
- Free technical support
Join 100,000+ Users
in 80 Countries


KnowWare International, Inc.
2696 S. Colorado Blvd., Ste. 555
Denver, CO 80222 USA
Toll-Free: 1-888-468-1537
Local: (303) 756-9144