How to Create a Run Chart in Excel Using QI Macros
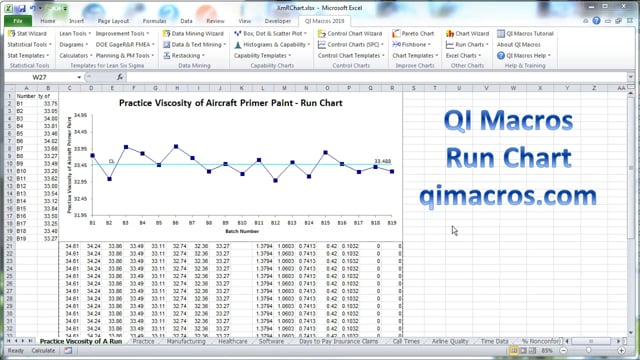
A run chart is a line graph of your data with a center line calculated using either the average or median of your data. QI Macros add-in for Excel makes it easy to create average and median run charts. Just select your data and then select run chart from our menu.
Watch this run chart video to see how easy it is to create run charts in Excel. Creating run charts has never been easier!
Why wait? Start creating these charts and diagrams in seconds using
QI Macros add-in for Excel.
Join 100,000+ Users
in 80 Countries

Why Choose QI Macros ?
Affordable - Just $
379 USD per license
- Less with Quantity Discounts
- No Recurring Annual Fees
- No Charge for Technical Support
Easy to Use
- Adds New Tab to Excel's Menu
- Creates a Chart in Seconds
- PC / Mac: Excel Excel 2021-2024, Office 365
Trusted /
Accurate
- 100,000 Users in 80 Countries
- Save Time vs Writing Formulas
- Our Formulas Are Tested

KnowWare International, Inc.
2696 S. Colorado Blvd., Ste. 555
Denver, CO 80222 USA
Toll-Free: 1-888-468-1537
Local: (303) 756-9144