How to Create a Histogram in Excel Using QI Macros
Are you having trouble:
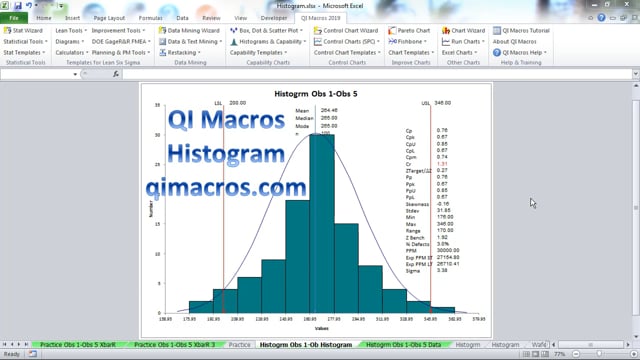
- Drawing histograms in Excel?
- Figuring out how to draw a bell shaped curve on your histogram?
- Calculating process capability metrics like Cp, Cpk, pp, Ppk?
QI Macros Six Sigma Software for Excel makes it easy to create histograms. Just select your data and then select Histogram with Cp Cpk from QI Macros menu.
Watch this histogram video to see how easy it is to create histograms in Excel.
Why wait? Start creating these charts and diagrams in seconds using
QI Macros add-in for Excel.
« Back
Join 100,000+ Users
in 80 Countries

Why Choose QI Macros ?
Affordable - Just $
379 USD per license
- Less with Quantity Discounts
- No Recurring Annual Fees
- No Charge for Technical Support
Easy to Use
- Adds New Tab to Excel's Menu
- Creates a Chart in Seconds
- PC / Mac: Excel Excel 2021-2024, Office 365
Trusted /
Accurate
- 100,000 Users in 80 Countries
- Save Time vs Writing Formulas
- Our Formulas Are Tested

KnowWare International, Inc.
2696 S. Colorado Blvd., Ste. 555
Denver, CO 80222 USA
Toll-Free: 1-888-468-1537
Local: (303) 756-9144