Real Time SPC for Excel
The Real Time SPC for Excel tool, parses your data, gage by gage, and automatically performs statistical analysis. It creates control charts, histograms, and calculates Cp and Cpk for each gage.
Here's how it works:
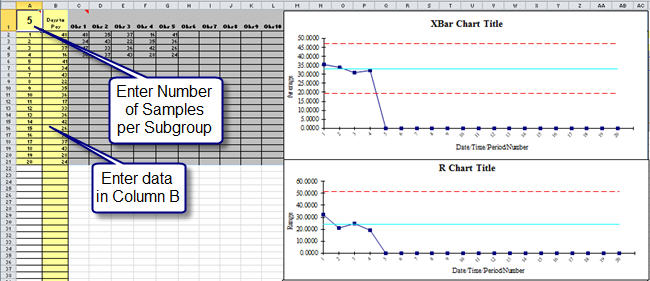
- Open the QI Macros XbarR template in Excel. Select the XbarR RealTime worksheet (added June 2017). It looks like this:
- Click on Cell
A1 and enter the number of samples per subgroup. If you have a USL and LSL, enter it in cells AM3 and AM5.
- Clear contents of cells B2:B21.
- Click on Cell B2 and start entering data. You can type this manually or use a gage interface (USB or RS232).
- As you add new data your charts and calculations will update automatically.
- You can add more rows by copying cell C21 down to C22 and beyond.
Download the Real Time SPC Case Study (PDF)
Why wait? Start creating these charts and diagrams in seconds using
QI Macros add-in for Excel.
Why wait? Start creating these charts and diagrams in seconds using
QI Macros add-in for Excel.
