Counting Bolts Case Study
The Statistics Library hosted by the Dept of Statistics at Carnegie Mellon University has an interesting case study submitted by W. Robert Stephenson, Iowa State University.
The case study is about counting and packaging bolts. Too few bolts per package causes complaints; too many increases costs.
A spinning plate forces bolts to the edge where they are counted by a sensor.
There are several adjustments on the machine that affect its operation.
- SPEED1 that controls the speed of rotation
- TOTAL number of bolts counted
- SPEED2 the speed of rotation for the last few bolts, the number of bolts to be counted
- NUMBER2 of bolts to be counted at this speedSENSsitivity of the electronic eye
- (SENS)TIME, in seconds, it takes to count the bolts.
- T20BOLT is the time to count 20 bolts.
The question is:
What settings result in the fastest counting of 20 bolts?
The data (slightly rearranged) looks like this:
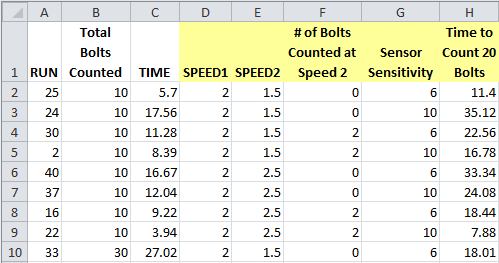
We could attempt to use ANOVA or DOE, but the easiest way to do this is by selecting D:H and running a Multivari chart:
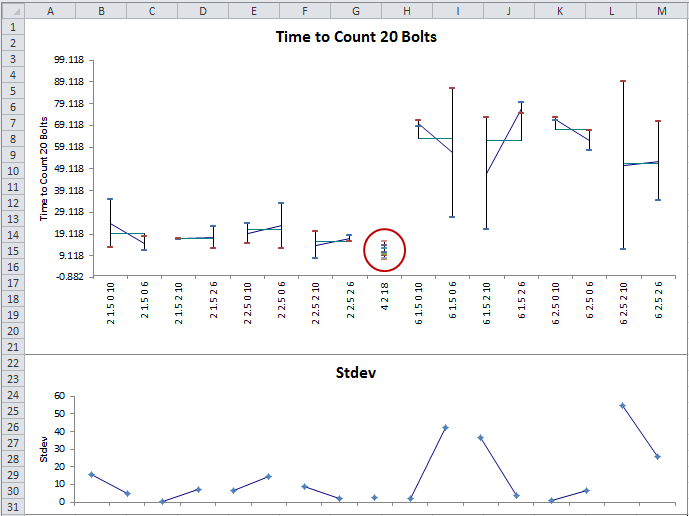
From this chart, it's easy to see that the fastest time with the least variation comes from a combination of Speed1=4, Speed2=2, Number2=1, Sensor=8.
Stop using old technology!
Upgrade Your Excel and Data Analysis Skills to Smart Charts Using QI Macros.
Track Data Over Time
Line Graph
Control Chart
Compare Categories
Pie Chart
Pareto Chart
Analyze Variation
Bar or Column Chart
Histogram
QI Macros add-in for Excel makes creating smart charts a snap.
Join 100,000+ Users
in 80 Countries

