Turn Excel into a
Lean Six Sigma Powerhousewith QIMacros Wizards and Templates
Learn in Minutes
Try QI Macros Excel Add-in - no credit card required!
Get Your FREE 30-Day TrialOr browse QI Macros products:
Buy Now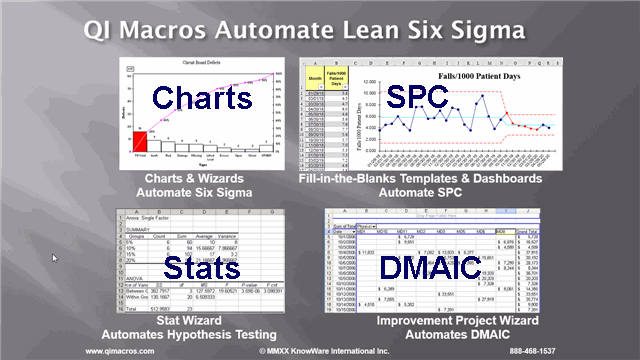
Learn QI Macros in an hour. Free Yellow Belt Training!
Yellow Belts save $10,000 per year. Give them the tools to do the job.
Several students have used this training and QI Macros to save $5 million.
Start Getting Results in Hours or Days, Not Months or Years
You don't have to be an expert; you just look like one!
Create Control Charts, Pareto Charts, and Process Capability Analysis Automatically—Right Inside Excel
-

Control Charts
Analyze the stability and predictability of a process over time.
Automated Control Chart Selection -

Pareto Charts
Use the 80-20/4-50 rule to focus improvement efforts.
Draw a Pareto chart in Excel -

Fishbone Diagrams
Dig down to reveal the root causes of a specific event.
Automated fishbone diagram template -
Control Chart Templates
Automate Statistical Process Control (SPC) - the "C" in DMAIC.
Automate SPC with QI Macros Templates -

Histograms
Automate process capability studies.
Create a Histogram with Cp, Cpk -

Six Sigma Templates
Fill-in-the-blank Excel Templates. SIPOC diagrams, Gage R&R, and hundreds more.
Automate Improvement Project Creation
A Flexible Tool For Statistical Analysis & Six Sigma
-
Automate with Fill-In-The-Blank Templates
Analyze SPC and LSS with control charts, fishbones, Gage R&R, DOE and more.
-
Automate Improvement Project Creation
The Improvement Project Wizard turns raw data into projects that find hidden opportunities for process improvement, automatically.
-
Automate Hypothesis Testing
The Stat Wizard automates hypothesis testing with ANOVA, t tests, f tests, regression analysis and normality tests.
What Do Our Customers Say?
-

"QI Macros is long on Six Sigma capabilities... ...many Green Belts and some Black Belts will be able to do everything they need with QI Macros… The familiar Excel interface reduces the learning curve..."
– Heidi Wiesenfelder
Bright Hub -

When looking for a statistical software package to recommend to my clients and to use in my Six Sigma Green, Black and Master Black classes we found QI Macros for Excel to be the best overall value.
– H. James Harrington
International Author, Speaker, Entrepreneur
CEO, Harrington Institute
