Want Help Learning QI Macros?
 The QI Macros online video tutorials contain self-paced, step-by-step instructions for installing and using QI Macros. Watch and listen as we guide you through each step of creating QI Macros charts. You'll learn the purpose of the charts, what type of data to use, and different methods for creating them. It's almost like having a personal Excel and QI Macros coach.
NOTE: This item provides access to online QI Macros video tutorials only.
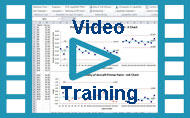
Click here to watch a sample video
Here are just some of the videos you'll have access to:
- QI Macros Installation
- QI Macros Menu Overview
- Data Formatting Tips
- Creating Control Charts
- QI Macros Chart Menu
- QI Macros Wizards:
- Control Chart Wizard
- Improvement Project Wizard
- Pivot Table Wizard
- Word Count Wizard
- Stat Wizard
- Control Chart Dashboards
- QI Macros Control Charts:
-
Attribute Control Charts (c, np, p, u)
-
Variable Control Charts (XmR, XbarR, XbarS)
- Pareto Charts
- Fishbone (Ishikawa) Diagrams
- Histograms
- QI Macros Stat Wizard
- Statistical Tools

Table of Contents Highlights:
QI Macros Overview
- The QI Macros Menu
- Video Tutorials
- Free Online Training Resources
- Creating Charts with QI Macros (Create a Chart Using a Macro/Create a Chart Using a Template)
- Data Formatting Tips
QI Macros Wizards
- Improvement Project Wizard
- Chart Wizard
- Control Chart Wizard
- PivotTable Wizard
- Statistics Wizard
- Word Count and Word/Number Count Wizard
- Paste Link/Paste Link Transpose
- Stack/Restack/Unstack
Control Charts
- Attribute Charts: c, np, p, u
- Variable Charts: XmR, XmR Trend, XbarR, XbarS, XMedianR, I-MR-R
- Control Chart Templates
- Control Chart Dashboards
- Stability Analysis
- Control Chart Rules
- QI Macros Chart Tools Tab to Automate Common Tasks: add data, change rules, etc.
Charts for Special Circumstances
- CUSUM, EWMA, Moving Average, Hotelling T2, Levey Jennings (Standard Deviation Chart), p' and u' Charts (Prime Charts)
Capability Charts
- Capability Suite
- Histogram with Cp Cpk, Frequency Histogram, Weibull Histogram
- Capability Templates
Box, Dot & Scatter Plot
- Box and Whisker, Dot, Matrix, Scatter and Values Plots
- Multivari Chart
- Tornado Chart
Improvement Charts
- Pareto Chart and Special Features
- Fishbone Diagram
- Countermeasures Matrix
Other Charts
- Run Chart
- Excel Charts
Statistical Tools
- ANOVA: Single Factor, Two Factor
- Chi-Squared
- F-test
- Regression Analysis
- Equivalence Test
- t-Tests
- Stat Templates
Fill-in-the-Blank Templates
- Control Chart Templates
- Histogram Templates
- Statistical Templates
Templates for Lean Six Sigma:
- Lean Tools: Spaghetti Diagrams, Value Stream Maps, Flow Chart, Time Tracking Tool, Time Value Map
- Diagrams: Tree, Arrow, Relationship Diagram
- Calculators: Sample Size, DPMO, RTY
- Improvement Tools: Cause Effect Matrix, Three-Legged, Five Why, Defect Tracking Matrix, Hazard Analysis - Bow Tie Risk Assessment
- DOE, Gage R&R, QFD, FMEA and Control Plan
- Planning and Project Management Tools: Voice of the Customer Matrix and Balanced Scorecard
What People Are Saying...
As the Manager of Training and Continuous Improvements, I found it easy to get employees trained even on their own time. How is that possible? By installing your self-teaching quality programs on a training computer and making it available to them.
I would bring the employee into my office and show them how to bring up the QI Macros CD on the training computer. In a short time, I found managers and engineers that knew nothing about FMEAs, DOEs, and Bar Graphs, watching your training CD with sound.
The step-by-step training was viewed at the rate of their learning capabilities so they understood what they were watching. They demonstrated what they learned with real data and were able to prove or disprove facts in a way they never could before.
One fact for sure, we hit 420 days without a lost time accident while in Chapter 11, and that was a savings of $750,000 in lost time accidents from the year before. One of the tools I used to make this happen was QI Macros with the Training CD. Because of this, I decided to go into my own business offering "Risk Control Investigation". To aid in any investigation I will recommend using your QI Macros.
Thank you for making it easier to teach in the manufacturing world.Richard Borcicky