Home » Free Training » Green Belt Videos » Arrow Diagram
Six Sigma - Arrow Diagram
Analyze Process Flows with Arrow Diagrams in Excel
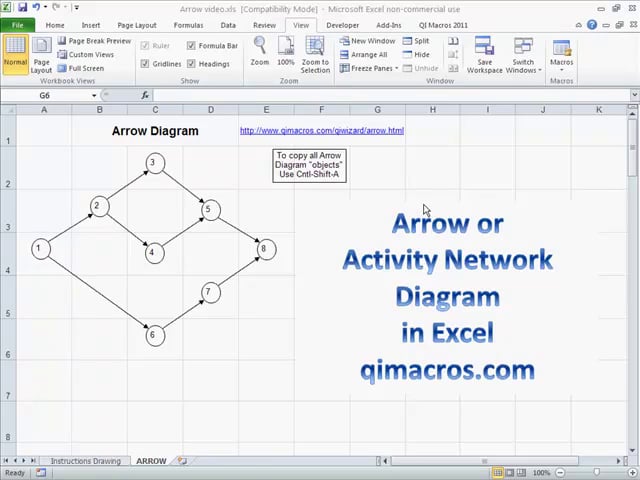
This video shows how to analyze process flows using Arrow or Activity Network Diagrams in Excel with QI Macros.
QI Macros Practice
Go to the "Templates for Lean Six Sigma" section and select Diagrams -> Arrow Diagram