Lean Six Sigma White Belt Exam

Allow an hour to take this exam. You cannot save your answers part way through and come back later. If you need to start and stop, we suggest printing it out and then inputting your answers all at once.

  • Cost is $75 USD to cover administrative costs of issuing White Belt Certificate.
  • You will only be asked to submit payment after you have successfully completed the exam (score of 80% or better).

Hint: I'm a fan of "All of the above" answers.


certificate


Questions

  1. Lean Six Sigma is a:
    Mindset for solving problems
    Method for solving problems
    Toolkit for solving problems
    All of the above
  2. Lean Six Sigma should focus on:
    The number of belts trained
    The number of teams started
    The results generated
    The number of meetings attended
  3. All business process suffer from:
    Delay
    Defects
    Deviation
    All of the above
  4. Lean is used to:
    Reduce or eliminate delay
    Reduce or eliminate non–value-added activities
    Reduce or eliminate defects
    All of the above
  5. Customers expect suppliers to be:
    Faster
    Better
    Cheaper
    All of the above
  6. The most effective methods for achieving breakthrough improvements in speed, quality, and profitability include:
    Common sense
    Trial and error
    Lean Six Sigma
  7. The key tools of Lean are:
    5S
    Spaghetti diagrams
    Value stream mapping
    All of the above
  8. The key tools of Six Sigma for reducing defects are:
    Control Chart
    Pareto chart
    Fishbone diagram
    All of the above
  9. The key tools of Six Sigma for reducing variation are:
    Control charts
    Histograms
    Box and Whisker plots
    All of the above
  10. You can double your speed:
    By working twice as hard
    Without working any harder by reducing delay
    By hiring more workers
    All of the above
  11. You can double your quality:
    By increasing inspection of finished goods
    Finding and fixing the root causes of defects
    Offering incentives for better performance
    All of the above
  12. The cost of sluggish, error-prone processes in a three sigma company can exceed how much of the total budget:
    10%
    15%
    20%
    25%
  13. Every company has a hidden:
    Service factory
    Fix-it factory
    Manufacturing plant
    All of the above
  14. When something goes wrong, you should blame your:
    Customers
    Employees
    Processes
    Products
    Services
  15. Lean Six Sigma is the key method and tool for achieving:
    Innovation
    Customer intimacy
    Operational effectiveness
    All of the above
  16. Lean Six Sigma only works in:
    Manufacturing
    Services
    Health care
    Information technologies
    All of the above
  17. Lean Six Sigma only works in:
    Fortune 500 companies
    Midsized companies
    Small businesses
    All of the above
  18. The universal improvement process embodied by Lean Six Sigma is:
    DMAIC
    DFSS
    PDCA
    FISH
  19. To get faster, you have to focus on your:
    Product or service
    Customers
    Suppliers
    Employees
  20. Lean's 5% rule says that:
    5% of the employees do 50% of the work
    5% of the products create 50% of the revenue
    Products or services are only worked on 5% of the total time
    All of the above
  21. To double your speed you only need to reduce your cycle or lead time by:
    60 minutes per hour
    15 minutes per hour
    6 minutes per hour
    30 minutes per hour
  22. Lean can help your business grow:
    50% faster than your industry
    2 times faster
    3 times faster
  23. Lean can help you increase profit margins by:
    10%
    20%
    50%
    100%
  24. Delays can be caused by:
    Time between steps in a process
    Waste and rework
    Large batch sizes
    All of the above
  25. Lean Six Sigma:
    Takes a long time to learn
    Has a "long tail" of tools used infrequently
    Requires an intricate knowledge of statistics
    All of the above
  26. The goal of Lean is to:
    Keep workers busy
    Prepare for customer demand
    Produce at the rate of customer demand
    None of the above
  27. The most common type of waste in any business is:
    Over production
    Excess inventory
    Waiting
    Unnecessary movement
    Unnecessary processing
  28. The first step in Lean is:
    Sort, straighten, shine, standardize, and sustain
    Red tagging
    Spaghetti diagramming
    Value stream mapping
  29. The easiest way to understand process flow is:
    Value stream map the process
    Spaghetti diagram the process
    Become the product or service going through the process
    None of the above
  30. The primary goal of lean is to reduce:
    Delay
    Waste
    Muda
    All of the above
  31. Six Sigma relies on:
    Common sense
    Trial and error
    Data and analysis
    Gut Feel
  32. The cost of not using Lean Six Sigma is what percent of total expenses:
    5-10%
    10-20%
    25-40%
  33. The first essential graph in the problem solving process is a:
    Fishbone Diagram
    Pareto chart
    Control chart
    Bar chart
  34. Critical to Quality (CTQ) measures include:
    Cycle time
    Defects
    Variation
    Cost
    All of the above
  35. The 4-50 rule says that:
    4% of your processes cause 50% of the mistakes, errors, defects, and variation
    4% of your delays consume 50% of the cycle time
    50% of your effort produces only 4% of the value
    All of the above
  36. The 4-50 rule means that you will need to draw a lot of:
    Bar Charts
    Pareto charts
    Fishbone diagrams
    Control charts
  37. Root Cause analysis asks:
    Who?
    What?
    When?
    Where?
    How?
    Why? Why? Why? Why? Why?
  38. The main cause of defects is:
    People
    Process
    Machines
    Materials
    Measurement
  39. Six Sigma can be used in:
    Manufacturing
    Service delivery
    Customer service
    Finance
    Information systems
    All of the above
  40. Lean Six Sigma helps plug the leaks in cash flow caused by:
    Sales
    Customers
    Internal processes
    All of the above
  41. The cause of variation is:
    Special
    Common
    All of the above
  42. Before you can evaluate a process's capability, the process must first be:
    Repeatable
    Stable
    Organized
    Understood
  43. The best tool for analyzing capability and showing variation in measured data is:
    Histogram
    Control Chart
    Scatter Chart
    Pareto Chart
  44. To determine your process’s capability, you will want to look at:
    Cp
    Cpk
    Pp
    Ppk
    All of the above
  45. If a process is unstable but seemingly capable, you will want to:
    Analyze and correct special causes of variation
    Analyze and correct common causes of variation
    Correct special causes and then reduce common cause variation
    Hope for the best
  46. If a process is stable but not capable, you will want to:
    Analyze and correct special causes of variation
    Analyze and correct common causes of variation
    Correct special causes and then reduce common cause variation
    Hope for the best
  47. To define a process flow, use a:
    Value stream map
    Flow chart
    Spaghetti diagram
    Any of the above
  48. The most overlooked and underused step in the DMAIC process is:
    Define
    Measure
    Analyze
    Improve
    Control
  49. When choosing a control chart, you will want the data to be:
    Variable (measured)
    Attribute (counted)
    Variable or Attribute
    None of the above
  50. Then, to choose a control chart, you will need to know the:
    Sample size
    Population
    Variation
    None of the above
  51. The attribute charts most often used are the:
    c, np, p, u
    XmR, XbarR, and XbarS
  52. The variable charts most often used are the:
    c, np, p, u
    XmR, XbarR, and XbarS
  53. A control chart may be unstable if the data violates which of these rules:
    A point outside of the UCL or LCL
    2 of 3 points above +2 sigma or below -2 sigma
    4 of 5 points above +1 sigma or below -1 sigma
    8 points in a row above or below the average
    6 points trending up or down
    All of the above
  54. There is more than one kind of control chart because:
    The underlying distribution is different
    The sample size is different
    Sample sizes vary
    All of the above
  55. Control charts and histograms help:
    Measure the process
    Monitor performance
    Detect shifts in performance
    All of the above
  56. The root cause of a problem is most often :
    At the same place the problem's first noticed
    The people involved
    Upstream from the point of detection
    None of the above
  57. The 3-57 Rule says:
    Make my day!
    Three people out of 57 cause most of the errors.
    People only work on the product for three minutes out of every hour.
  58. The 4-50 Rule says:
    Four steps out of 50 cause most of the waste and rework.
    Four percent of the steps cause 50 percent of the waste and rework..
    One step out of 25 causes 50 percent of the waste and rework..
  59. The key tool for sustaining an improvement (i.e., Control phase of DMAIC) is:
    Control Chart
    Histogram
    Flow Chart
    All of the above
  60. To maximize the effectiveness of Lean Six Sigma:
    Train everyone
    Start lots of teams
    Use data to laser focus improvement projects
    All of the above

By submitting your answers, you certify that you have:

  • Watched all of the videos in the White Belt Curriculum.
  • Completed the dojo exercises using the QI Macros.
A passing grade (score of 80% or better) will give you the opportunity to order a digital White Belt Certification ($75 USD) from KnowWare International, Inc.

To receive an email with your score, enter your name and email here:

Your Name*:
Your Email*:

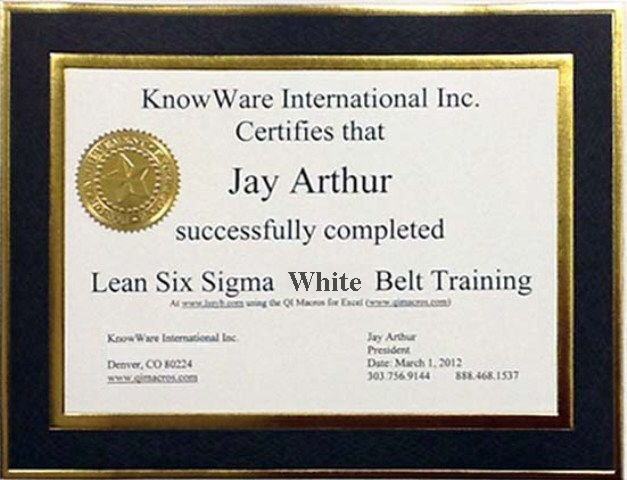
You are almost done! To receive your certification, complete the order process on the next page.

NOTE: If your company would like to certify 50+ White Belts using this curriculum, give us a call to find out how.