Need to Create a Funnel Plot in Excel?
QI Macros has a Ready-Made Funnel Plot Template for Excel!
Why it Matters: Funnel Plots help compare companies, facilities or teams to a target.
Funnel-shaped "Confidence Intervals" provide an estimate of quality. These 95% and 99% Intervals can be defined as a percent or as a rate per 1,000.
Please note that you must have (10) or more rows of data to perform a successful Funnel Plot.
Confidence Intervals
The further away your point is from the Average line, the more concerning the output can be interpreted as.
If your point falls between the Average line and the 95% Confidence Interval, this can be interpreted as a good thing!
When your point(s) fall between the 95% and 99% Confidence Interval, this can be interpreted that your point is now in the “Warning Zone” – while it’s not necessarily bad, it is getting towards the threshold of falling outside (above/below) the Upper/Lower 99% Confidence Interval. And once it is above/below the Upper/Lower 99%, the point can now be considered “Concerning.”
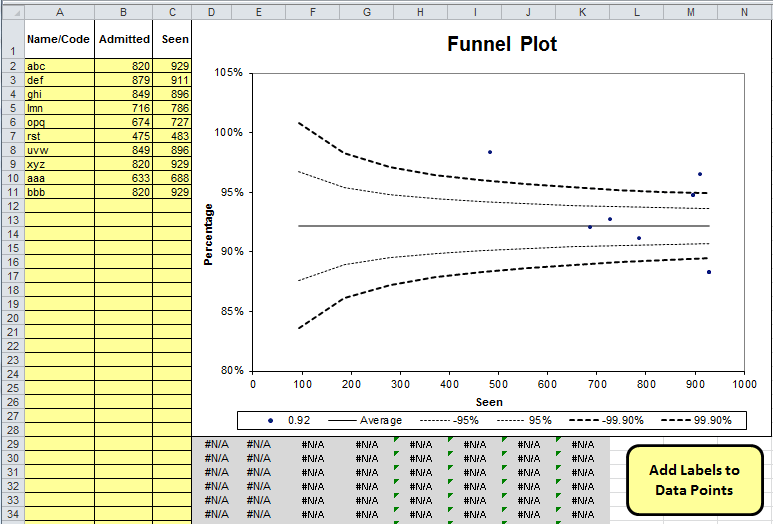
Percent Funnel Plot Example
Notice that most of the organizations lie along the Average line, as well as within the 95% and 99% Confidence Intervals. This means that ranking and comparisons would not be useful.
There are, however, a few outside of the 99% Interval, which indicates these organizations could benefit from improvement:
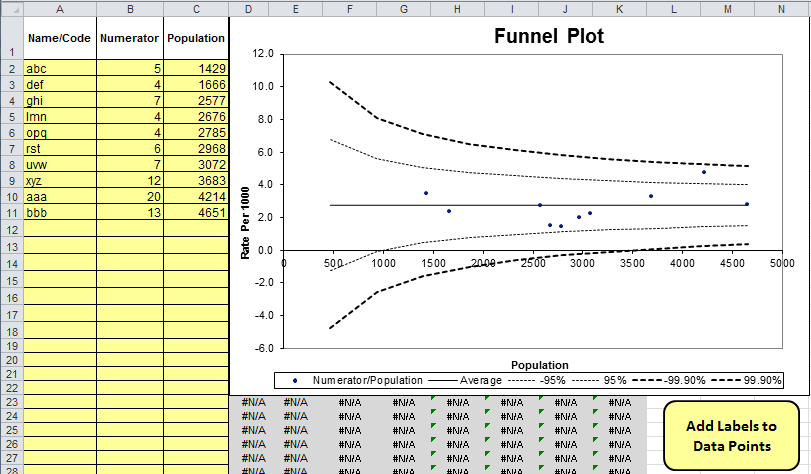
Rate per 1,000 Funnel Plot Example
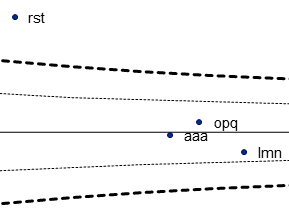
Funnel Plot Data Point Labels
As a default, QI Macros funnel plot templates do not show labels on the data points. However, if you want to add labels to your data points, just click on the "Add Labels to Data points" button in the lower right corner of the template:
Labels will then be automatically added to your points:
Haven't you waited long enough?
Start creating your Funnel Plot template in just minutes.
Download a free 30-day trial. Get the Funnel Plot template now!
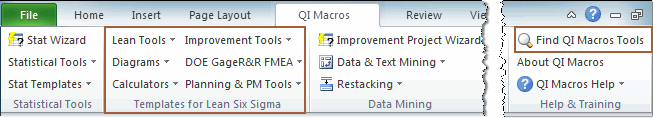
The Funnel Plot template is one of many tools included in QI Macros add-in for Excel.
QI Macros adds a new tab to Excel's menu, making it easy to find any tool you need. If you can't locate a tool, use the find tools feature on the far right side of QI Macros menu.