Want to Do a Two-Sample t-Test in Excel?
QI Macros can do it for you!
Run a t-Test in Excel using QI Macros:
- Select your data.
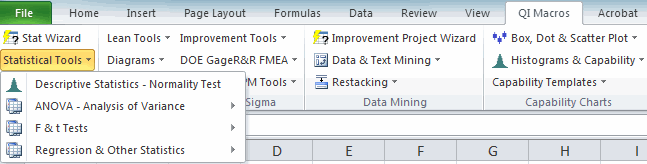
- Click on QI Macros menu > Statistical Tools > F & t Tests > t-Test Equal Variances.
- QI Macros will do the math and analysis for you.
You can do a t-Test in Excel using the Data Analysis Toolpak, but...
- Excel's interface can be confusing; QI Macros adds a new tab to Excel's menu making t-Tests point-and-click simple.
- Excel won't interpret your p-value for you; QI Macros Add-in will!
- Excel won't draw a Values Plot of the two factors; QI Macros Add-in will!
Example of Two-Sample t-Test Using QI Macros
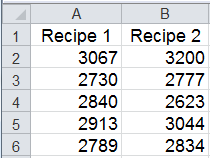
Lets say you're producing rubber made from two different recipes and you want to know if the tensile strengths are the same or different. You test five samples of each to get the data:
Next Determine if the Variances are Equal or Unequal
In order to select the correct Two Sample t-Test, you need to determine if the variances are equal or unequal. QI Macros offers two options:
- Use the QI Macros Stat Wizard. It will run an F-test and then automatically choose the right t-Test for you.
- Run an F-test on the data to determine if the variances are equal or unequal. Then run the appropriate t-Test.
To Run a t-Test Using QI Macros:
- Select the data and click on QI Macros Menu > Statistical Tools > F & t Tests > t-Test: Two-Sample Assuming Equal Variances or Unequal Variances, depending on the F-test results:
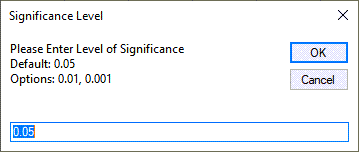
- QI Macros will prompt you for a significance level:
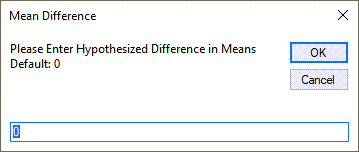
- Next, QI Macros will prompt for the hypothesized difference in the means (default is 0).
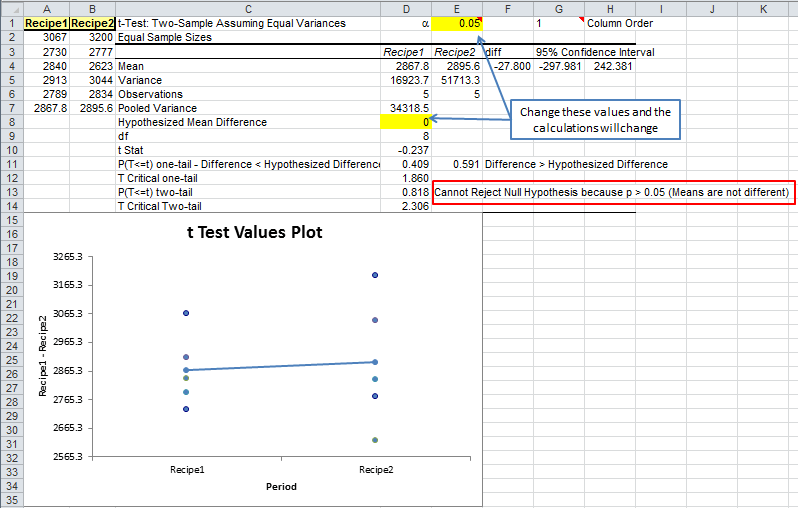
- QI Macros will perform the calculations and interpret the results for you:
Note: Significance Level = (1 - Confidence Level).
NOTE: QI Macros versions prior to July 2022 draw a Box and Whisker Plot vs a Values Plot.
What's Unique about QI Macros Statistical Tests?
Interprets the results for you:
QI Macros compares the p-value (0.818) to the significance level (0.05) and tells you "Cannot Reject the Null Hypothesis because p>0.05 (Means are not Different)."
Draws a chart to help you visualize the results:
QI Macros draws a Values Plot to help you visualize the difference between the variances (height of the dots) and means (line drawn between the values).
- two-tail p value (Difference = Hypothesized Mean Difference)
- one-tail p value (Difference < Hypothesized Mean Difference)
- 1-one tail p value (Difference > Hypothesized Mean Difference)
NOTE: If your t-Test determines Means are not Different, than your TOST output will state "Cannot conclude means are equivalent."
To change the order of your Two-Sample t-Test results between the first and last columns:
QI Macros enables you to easily change the order of your data sets. See row 1 for the cell labeled column order (H1 Above). You have the option to update the "Column Order" by inputting value "1" (Column 1/Column 2) or "2" (Column 2/Column 1):
![]()
NOTE: Changing the order of your t-test column order will not change the Values Plot.
