Struggling with Process Capability Analysis?
Even If You Don't Know ANYTHING About Capability Analysis,
QI Macros Will Analyze Capability for You.
Process Capability Analysis Identifies Performance Problems...And What to Do About them!
Go Deeper: A capable process meets customer requirements 100% of the time. Customer requirements are defined using an upper specification limit (USL) and a lower specification limit (LSL). Think of these specification limits as goal posts.
Not Capable
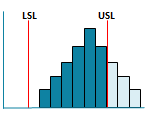
Cp < 1, Cpk <1
Cp < 1, Cpk <1
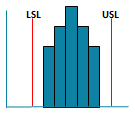
Centered - Does not Fit
Cp < 1, Cpk >= 1
Cp < 1, Cpk >= 1
Fits Not Centered
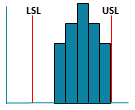
Cp >= 1, Cpk <1
Cp >= 1, Cpk <1
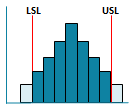
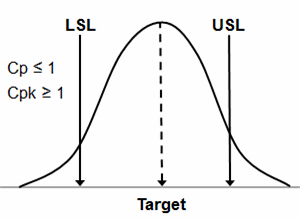
Capable
Cp >= 1, Cpk >= 1
Cp >= 1, Cpk >= 1
Process capability metrics Cp Cpk and Pp Ppk determine how well a stable process meets these specifications. All of these metrics can be calculated using QI Macros histogram or cp cpk template. Download a free 30-day trial.
Cp Cpk and Pp Ppk
Cp and Cpk |
|
|---|---|
| Cp | How well the data would fit within the spec limits (USL, LSL) |
| Cpk | How centered the data is between the spec limits. |
| Use Cp Cpk | When you have a sample, not the population, and are testing the potential capability of a process to meet customer needs. |
| Cp Cpk | Formulas use Sigma estimator. |
Pp and Ppk |
|
|---|---|
| Pp | How well the data would fit within the spec limits (USL, LSL) |
| Ppk | How centered the data is between the spec limits. |
| Use Pp Ppk | When you have the total population and are testing the performance of a system to meet customer needs. |
| Pp Ppk | Formulas use standard deviation. |
Cp vs Cpk Examples
Fits But Is Not Centered
|
| Process improvement goal is to move the output closer to the target without increasing variation. |
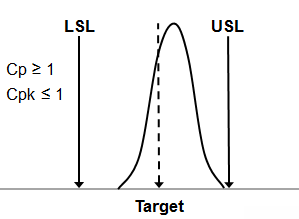
Centered But Does Not Fit
|
Process improvement goal is to reduce variation so that the process fits between the spec limits. |
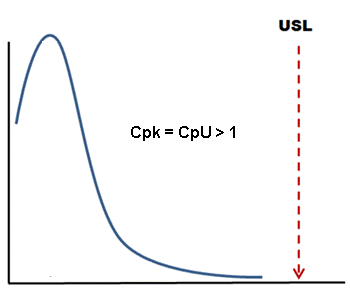
One-sided Spec Limits
One-Sided Spec Limit
|
|
Don't confuse a "hard limit," (i.e. zero) for a "spec limit". |
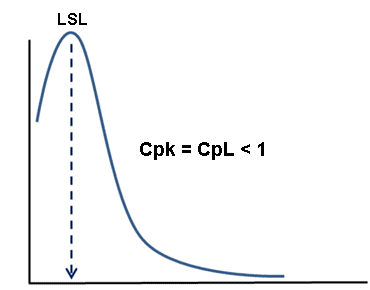
One-Sided Spec Limit
|
If you enter an LSL of zero, Cpk uses CpkL which means Cpk < 1 because the mean is closer to zero. |
Capability Analysis Metrics Rules of Thumb
- Cp > 1 Process is capable (product will fit between the customer's upper and lower specification limits if the process is centered).
- Cpk > 1 Process is capable and centered between the LSL and USL.
- If Cp = Cpk the process is centered at the midpoint of the specification limits.
- If Cp > Cpk the process is off-center.
- Cp and Cpk should be close in value to Pp and Ppk.
- If Cp and Cpk are much greater than Pp or Ppk (33% greater), your process may not be stable enough to conduct a capability analysis. Use control charts to evaluate the stability of your process.
Stop Struggling with Process Capability Analysis!
Start creating your Process Capability Analysis in just minutes.
Download a free 30-day trial. Get Process Capability Analysis now!
QI Macros Draws These Charts Too!
