Tired of Trying to Make Histograms in Excel?
QI Macros Automates Histograms and Capability Analysis!
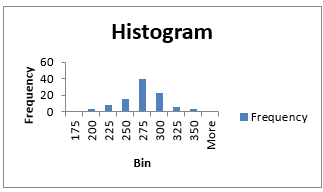
Let's face it. Excel's Data Analysis Toolpak is cumbersome and the output is fairly basic. It's missing a curve line, spec limits (aka goalposts) and process capability metrics that provide insights into your data.
Up Your Data Analysis Game using QI Macros Histogram Maker.
Draw a Histogram using QI Macros:
- Select your data.
- Select Histograms & Capability from QI Macros menu.
- QI Macros will do the math and draw the graph for you. This includes Capability Metrics such as Cp and Cpk.
Why Do Histograms Matter?
Histograms determine the capability of your process. Does the product meet the customer's requirements? Is it on target?
Go Deeper: What are Histograms?
Histograms show the spread, or dispersion, of variable data. They are most valuable when they display your customer's requirements as goal posts. Does your data fit (Cp)? Is it centered (Cpk)?
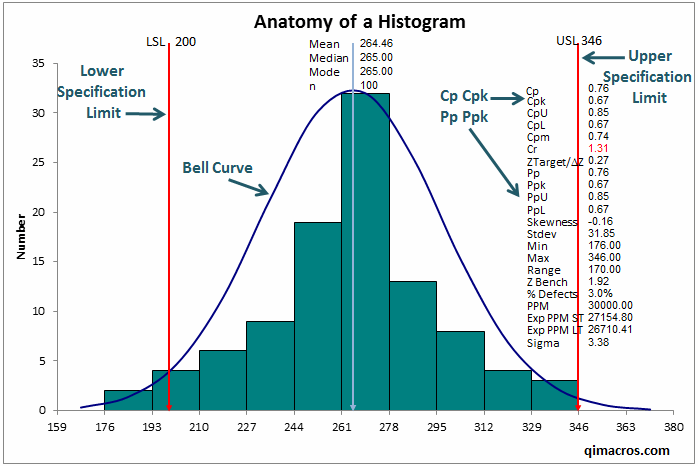
Customer Requirements are the Specification Limits (Goal Posts)
Experts refer to these goal posts as specification limits. There can be both an upper spec limit (USL) and a lower spec limit (LSL) or just one of the two. Data points outside of the spec limits represent products or processes that don't meet customer requirements.
The best histogram makers will also calculate process capability metrics Cp, Cpk and Pp Ppk. These are numeric values that tell you how well your process is meeting customer requirements.
What is Cool about QI Macros Histogram Maker in Excel?
- Calculates more than 20 process capability analysis metrics including Cp Cpk and Pp Ppk.
- Draws a bell curve.
- It is interactive:
- Calculations can be viewed and updated in the Excel worksheet created by QI Macros.
- Allows you to experiment with how spec limits impact Cp Cpk by changing them in the histogram calculations worksheet.
- Allows you to adjust histogram bin intervals (width of bars) and the approximate number of bars.
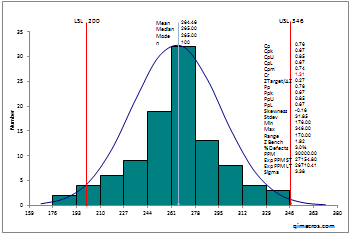
Which Histogram Do You Want to Send to Your Boss or Customer?
I am very impressed with QI Macros Software. I work with Excel eight hours a day and thought that I had written macros that made me efficient. The Control Charting and Histogram macros in QI Macros alone have saved me hours of work and allowed me to present data to management in a format that is meaningful.
- Kyle Dopp
First Choice Solutions
Stop Struggling with Histograms!
Start creating your Histograms in just minutes.
Download a free 30-day trial. Get Histograms now!
QI Macros Draws These Charts Too!
