Statistical Process Control
Monitor Processes with Statistical Process Control
To maximize productivity and quality, businesses from manufacturing to healthcare use Statistical Process Control to monitor processes. Since all processes suffer from some forms of variation, the main goal is reduce variation in finished products and services.
Download our free Statistical Process Control (SPC) How To Guide
There are Two Types of Process Variation to be Controlled:
- Special cause variation - These spurious changes in performance are easily detected by control charts and corrected with Root Cause Analysis using the 5 Whys.
- Common cause variation - These chronic causes of variation are the focus on ongoing improvement efforts. Both control charts and histograms are used to evaluate common cause variation.
The Two Most Common Statistical Process Control Tools are:
Histograms help determine if the process can deliver products and services that meet or exceed the customer's requirements.
Control Charts are used to monitor process stability and predictability. Control charts help detect unusual changes in performance in ways that allow for root cause analysis and corrective action. There are many different kinds of control charts for different types of data and distributions.
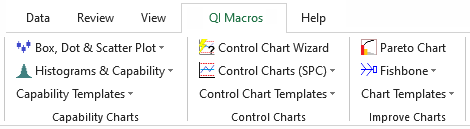
Statistical Process Control Software that Works Right in Excel
Most Statistical Process Control Software is expensive and complex. However, QI Macros makes creating control charts and histograms a snap. QI Macros installs on Excel's menu:
To create a chart:
- Select your data - click and drag over your data to select it.
- Select the chart - click on QI Macros menu and choose the chart you want. If you are not sure which chart to choose, QI Macros is smart enough to analyze your data and select the right chart for you.
- QI Macros does the rest - QI Macros does all of the calculations and draws the charts. Control charts will highlight unstable conditions that should be investigated in red. Histograms contain Cp and Cpk process capability calculations.
SPC Charts in QI Macros Statistical Process Control Software
Histograms
Other Statistical Process Control Tools
Join 100,000+ Users
in 80 Countries
![]()


KnowWare International, Inc.
2696 S. Colorado Blvd., Ste. 555
Denver, CO 80222 USA
Toll-Free: 1-888-468-1537
Local: (303) 756-9144
©
1997 - 2024 KnowWare International Inc. All Rights Reserved. Legal Info | Terms of Use