Home » Free Training » Yellow Belt Videos » SPC Case Study - Acid Concentration
SPC Case Study - Automotive Acid Concentration
Use XmR Charts and Histograms to Evaluate Stability and Capability
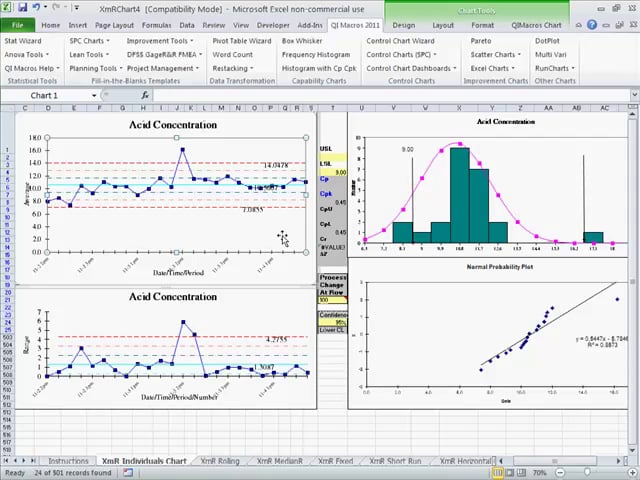
This video shows how to evaluate process stability and capability using individual moving range control charts and histograms with Cp and Cpk on automotive data.
QI Macros & Excel Practice
Open QI Macros Test Data/AIAG SPC.xlsx/XmR worksheet and run XmR Chart.