Easy to Use Excel Add-in Draws Histograms
Draw a Histogram using QI Macros:
- Select your data.
- Select Histograms & Capability from QI Macros menu.
- QI Macros will do the math and draw the graph for you.
Excel's Data Analysis Toolpack Can be Cumbersome
QI Macros Adds a Menu to Excel and Creates Histograms in Three Easy Steps
Compatible with:
- Windows 10 and 11
- Excel 2021-2024, Office 365
- macOS
- Excel 2019-2024, and Office 365
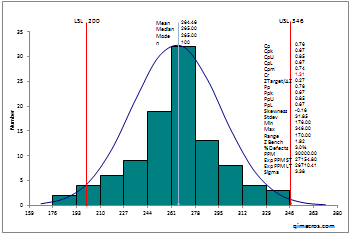
Which Histogram Do You Want to Send to Your Boss or Customer?
QI Macros Histogram with spec limits and metrics
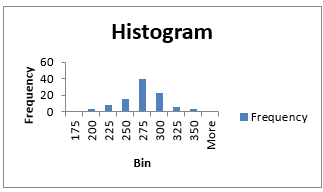
Histogram Made with Excel's Data Analysis Tool pak
QI Macros Features Not Contained in Excel
- A bell curve
- Descriptive statistics (mean, median, mode, etc.)
- Process capability metrics - Cp, Cpk, Pp, Ppk.
- Easily change width of bars and # of bars.
The QI Macros has been a really useful tool for me since 2000. I use the Pareto Chart and the Histogram on a daily basis. It has even been praised by the Corporate Auditors for the last three years as well as our ISO Registrar.
– Rich Richardson, Quality Assurance Manager,
Muller Martini Mfg. Corp
Why Choose QI Macros Over Other Histogram Software
![]()
Faster to Learn
and Easier to Use
- Works right in Excel
- Create charts in seconds
- Easy to customize & share charts
- Free Training Anytime
![]()
Proven and Trusted
- More than 100,000 users
- In More than 80 countries
- Five Star CNET Rating - Virus free
![]()
Affordable
- Only $375 USD
Quantity Discounts Available - No annual subscription fees
- Free technical support
