Automated SPC and Quality Improvement Software for Excel
Easily create SPC charts and Six Sigma improvement projects with QI Macros
QI Macros installs onto Excel's menu.
To create a chart:
- Select your data
- Click on QI Macros menu
- Select the chart you need*
QI Macros does the rest.
Not sure which chart to run?
QI Macros control chart wizard will analyze your data and run the right chart for you.
Why It Matters:
Learning SPC and Six Sigma is hard enough without having to learn formulas, choose charts and so on. QI Macros automates the complicated stuff so that you can start making improvements immediately. This also means it's easier to teach, reducing the time it takes to train people, shaving a day or more off most trainings.
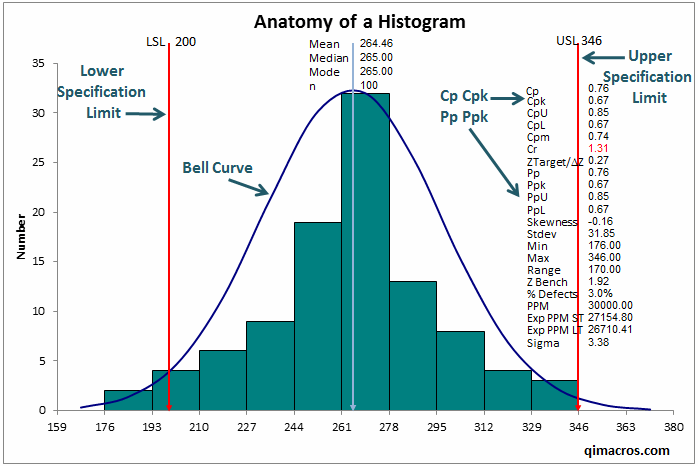
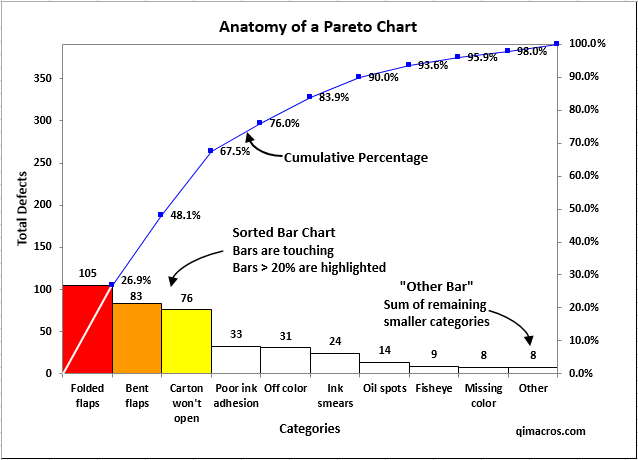
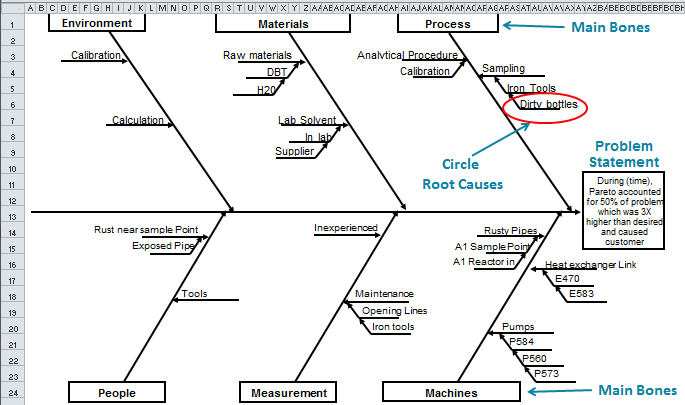
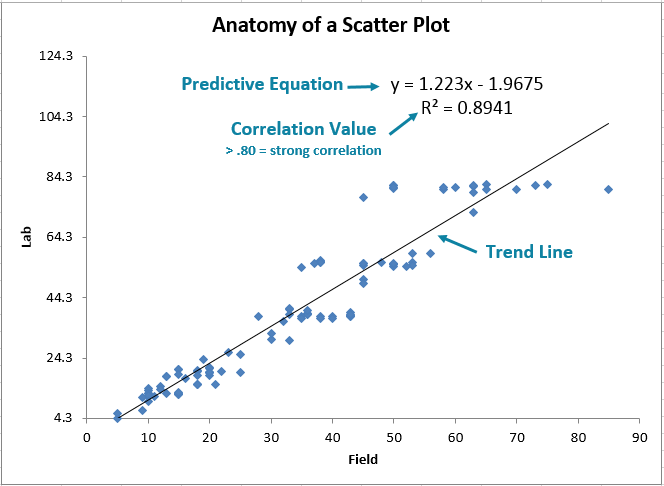
SPC Chart examples created using QI Macros SPC Excel add-in

QI Macros SPC software has outstanding value, particularly when compared to software packages that cost much more. It has all the functionality needed for leading, managing, and performing the technical work of quality/process improvement and product/service development efforts. The user friendliness is excellent. The training and technical support is excellent. Highly recommended!
- Allen Gates
Univ of Wisconsin, Six Sigma Instructor
Advanced Features You Won't Find Anywhere Else
![]()
Wizards
Rules built into our code
Not just decision trees
![]()
Automation
Automates common tasks
Interprets results for you
- Add data, change limits, apply formats, etc.
- Control Chart Dashboards
- Interprets statistical tests
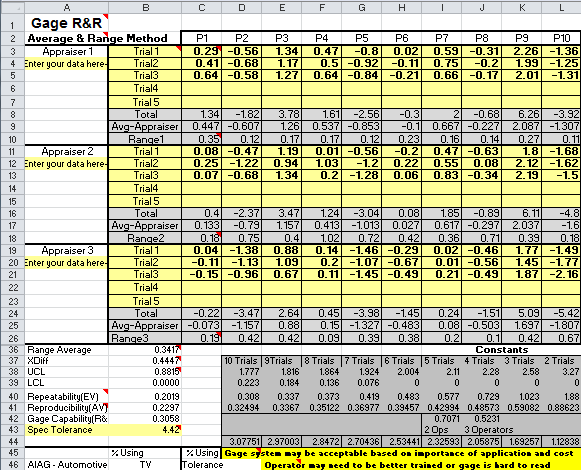
- Interprets Gage R&R results
- Mistake proofs data selection
![]()
Templates
Fill-in-the-blank templates for
charts, calculations and diagrams
When looking for a statistical software package to recommend to my clients and to use in my Six Sigma Green, Black and Master Black classes we found QI Macros for Excel to be the best over all value.
- H. James Harrington
CEO, Harrington Institute
More Reasons to Choose QI Macros
![]()
Faster to Learn
and Easier to Use
- Works right in Excel
- Create charts in seconds
- Easy to customize & share charts
- Free Training Anytime
![]()
Proven and Trusted
- More than 100,000 users
- In More than 80 countries
- Five Star CNET Rating - Virus free
![]()
Affordable
- Only $379 USD
Quantity Discounts Available - No annual subscription fees
- Free technical support
Join 100,000+ Users
in 80 Countries


KnowWare International, Inc.
2696 S. Colorado Blvd., Ste. 555
Denver, CO 80222 USA
Toll-Free: 1-888-468-1537
Local: (303) 756-9144