Need to Transform Non-normal Data using Box Cox Transformation?
QI Macros can run a Box Cox Transformation on your data in seconds!
Box Cox Transformation uses a statistical calculation to transform non-normal data to a normal distribution so that additional analysis can be performed. Box Cox transformation requires data to be continuous (measured) and to only contain positive values.
Box Cox transformation shifts the data to a root of the data using lambda:
-1< lambda <1 (e.g., 3.01^0.5) or ln(3.01) if lambda = 0.
Box Cox Transformation Example Using QI Macros for Excel:
- Click and drag over your data to select it.
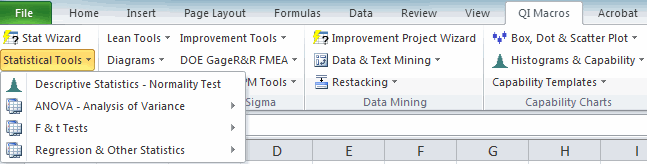
- Click on the QI Macros menu > Statistical Tools -> Regression and Other Statistics > Box Cox.
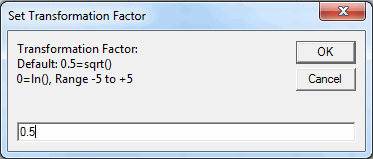
- QI Macros will prompt you for a transformation factor.
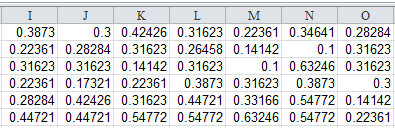
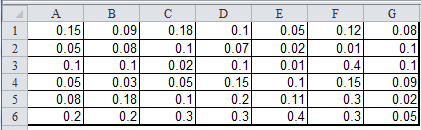
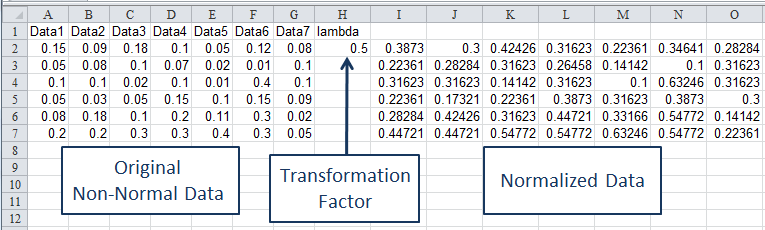
- QI Macros results will include your original data to the left, the transformation factor (lamba) and the transformed normalized data. If you change lambda, the normalized data values will change.
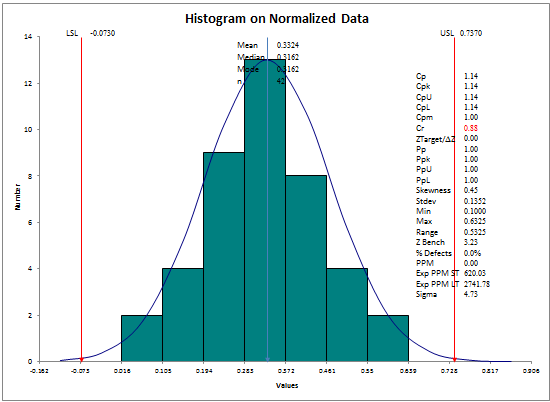
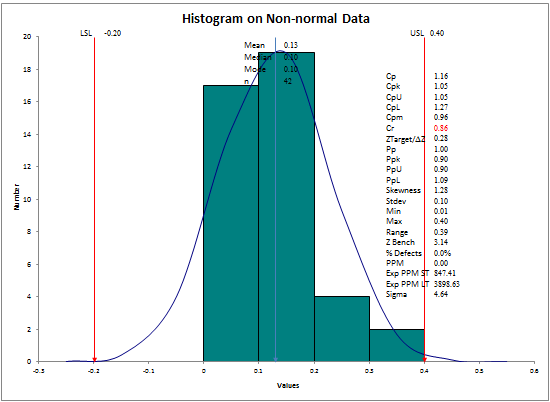
If we ran a histogram on the before and after data sets we can compare the non-normal and normal distributions.
Non-normal Data
Normalized Data