Need a Histogram with One-Sided Spec Tolerance?
QI Macros Can Create Histograms with One-Sided or Unilateral Spec Tolerance!
Histograms show the spread or dispersion of variable data using the number of times data points fall into each of the bars on the histogram. Upper and lower specification limits act like goal posts and help you see how well your data fits your customer's requirements.
Most processes have an upper and lower set of requirements. For example, the length of a part might need to be between 1.1 and 1.2 cm long. Some processes, however, only have one spec limit. For example, the wait time in a grocery line might be no more than 3 minutes. There is no lower spec limit. These instances are referred to as one-sided spec tolerance or unilateral spec tolerance.
To Create a Histogram with One-Sided Tolerance using QI Macros:
- Click and drag over your data to select it and then select histogram from QI Macros menu.
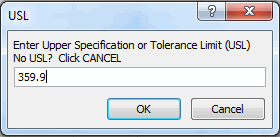
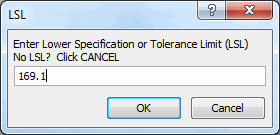
- QI Macros will prompt you for the spec limits. You may use the default spec limits or input your own. For a one-sided tolerance just select "Cancel" when asked for the spec limit that doesn't exist. This can be either the USL or LSL, depending on what aspect of your data you wish to have one-sided.
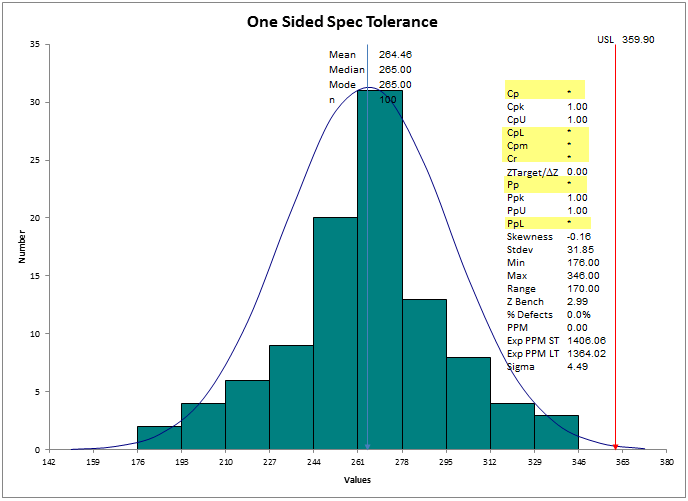
- Below is an example of a One-Sided Histogram, created with the LSL cancelled. Notice the Cp, CpL, Cpm, Cr, Pp, and PpL metrics are not calculated. These metrics can't be calculated with only one spec limit.
(If you select, "Cancel" on both the USL and LSL prompts, you will receive a chart with minimal metrics.)
How to create a one-sided / unilateral tolerance histogram, using QI Macros Histogram Template:
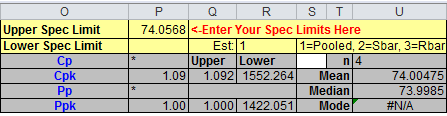
Open the histogram template under Capability Templates > Histogram with Cp Cpk. Click on the histogram tab and go to the cells in the template where the USL and LSL are defined (e.g. P1 and P2). To create a one-side histogram, delete the value in the cell and leave it blank. Do NOT put a "0" into the cell.
Stop Struggling with Histograms!
Start creating your Histograms in just minutes.
Download a free 30-day trial. Get Histograms now!
Other Charts Included in QI Macros for Excel
