How to Create an IshiKawa Fishbone Diagram in Excel
Use an ishikawa fishbone diagram to perform root cause analysis. Ask why, why, why, until you get to the root cause.
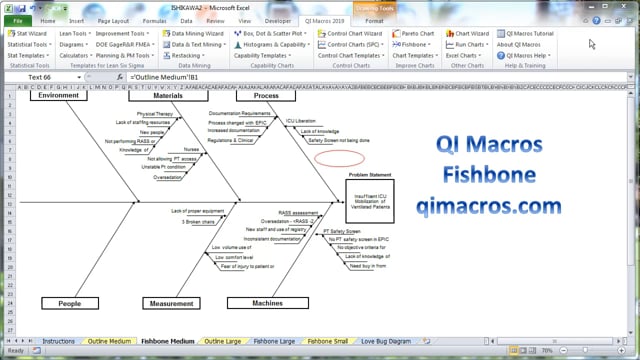
The QI Macros Six Sigma Software for Excel makes it easy to create ishikawa fishbone diagrams in Excel. Just open our fill in the blanks template and fill out your fishbone.
Watch this video to see how easy it is to create Ishikawa Fishbone diagrams in Excel. Documenting Your Six Sigma Process Improvement Projects Has Never Been Easier!
Learn more about asking the Five Whys

Why wait? Start creating these charts and diagrams in seconds using
QI Macros add-in for Excel.
Join 100,000+ Users
in 80 Countries
![]()
Why Choose QI Macros ?
Affordable - Just $
369 USD per license
- Less with Quantity Discounts
- No Recurring Annual Fees
- No Charge for Technical Support
Easy to Use
- Adds New Tab to Excel's Menu
- Creates a Chart in Seconds
- PC / Mac: Excel Excel 2013-2021, Office 365
Trusted /
Accurate
- 100,000 Users in 80 Countries
- Save Time vs Writing Formulas
- Our Formulas Are Tested

KnowWare International, Inc.
2696 S. Colorado Blvd., Ste. 555
Denver, CO 80222 USA
Toll-Free: 1-888-468-1537
Local: (303) 756-9144