How to Create a Control Chart in Excel Using QI Macros
Are you having trouble:
- Trying to decipher complex control chart formulas?
- Choosing the right control chart for your data?
- Determining which points or trends are unstable?
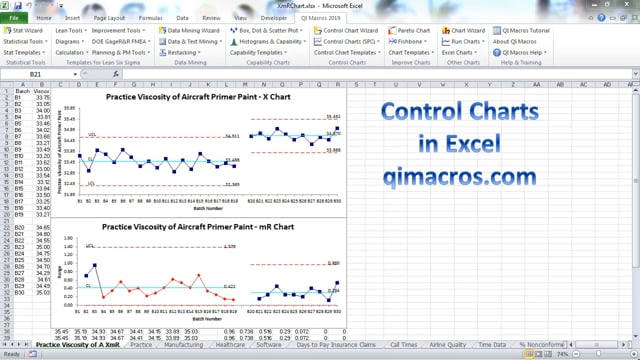
The QI Macros Six Sigma Software for Excel creates attribute and variable control charts and specialized charts like the EWMA and Cusum charts. Just select your data and then select the chart you want from our menu.
Not sure which chart to choose? Our control chart wizard will analyze your data and select the right control chart for you.
Watch this control chart video to see how easy it is to create control charts in Excel.
Why wait? Start creating these charts and diagrams in seconds using
QI Macros add-in for Excel.
Why wait? Start creating these charts and diagrams in seconds using
QI Macros add-in for Excel.
« Back
Join 100,000+ Users
in 80 Countries
![]()
Why Choose QI Macros ?
Affordable - Just $
369 USD per license
- Less with Quantity Discounts
- No Recurring Annual Fees
- No Charge for Technical Support
Easy to Use
- Adds New Tab to Excel's Menu
- Creates a Chart in Seconds
- PC / Mac: Excel Excel 2013-2021, Office 365
Trusted /
Accurate
- 100,000 Users in 80 Countries
- Save Time vs Writing Formulas
- Our Formulas Are Tested

KnowWare International, Inc.
2696 S. Colorado Blvd., Ste. 555
Denver, CO 80222 USA
Toll-Free: 1-888-468-1537
Local: (303) 756-9144