Histograms and Process Capability Analysis
Having trouble understanding histograms and process capability indices? What is the difference between Cp, Cpk, Pp and Ppk. What do they mean?
Our Histogram Whitepaper covers the essentials you need to understand histograms, distributions and process capability indices Cp, Cpk, Pp and Ppk. Our 19 page whitepaper also includes formulas and sample calculations.
Ever noticed that most SPC and statistics books give you the formulas but they never take just one data set and SHOW you how the formulas work. We do! Here is a sample.
Histogram Whitepaper Table of Contents:
- Product and Process Variation
- Process Capability Analysis Requires Stability
- Understanding Distributions
- Histograms
- Capability Indices
- Defects Per Million
- Interpreting the Results to Improve Your Process
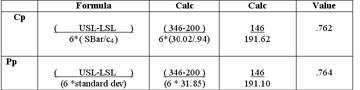
- Formulas
- Cp and Pp
- Cpk and Ppk
- Sigma Estimator
- Constants for Sigma Estimator Calculation
- One Sided Spec Limits
- Defects Per Million
- Z scores
- Sample Calculations
- Running a Histogram in the QI Macros SPC Software
- QI Macros Calculation Spreadsheet
The Histogram Whitepaper is available in PDF format for immediate download. Click Here.