QI Macros vs Minitab® for Ease of Use
You'll Never Struggle with Statistics or SPC Charts Ever Again!
According to its website, "Minitab® Statistical Software was developed in 1972 by three statistics instructors ... and remains the world's leading software for teaching statistics."
Hmmm, if you are a statistics student that's great! But if you work on a factory floor, are a nurse in a hospital or are a quality improvement professional in any other industry - that's a problem.
Many people have spent five days or more in Minitab® training over the years. For some, it's hard to let go of this investment in training, but let's compare the two products for ease of use on a simple control chart. If your data is in Excel (which most data is these days), here's how it works.
QI Macros® |
1. In Excel, select your data: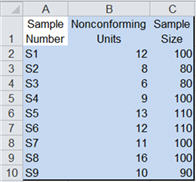 |
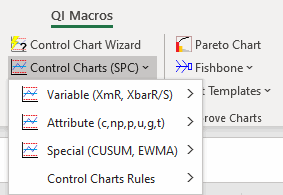
2. Click on the QI Macros Menu and select the desired
chart: |
3. The QI Macros will prompt you for titles and draw
the chart: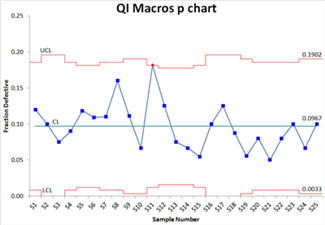 |
| The QI Macros automatically evaluate your data and select these for you. |
| The QI Macros automatically apply all rules. You can change the default rules. |
Minitab® |
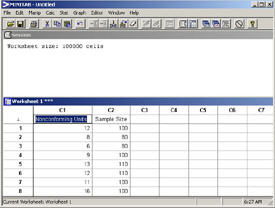
1. In Excel, select your data: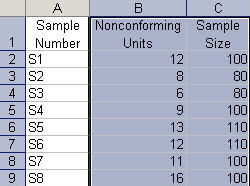 |
2. Paste your data into Minitab®:
|
3. Click on the Minitab® menu and select the
desired chart: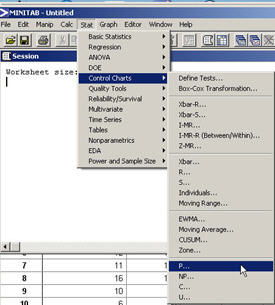 |
4. Select the columns of data to be included in the chart
one by one: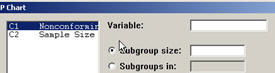 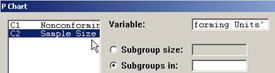 |
5. Select the stability rules to apply and click OK: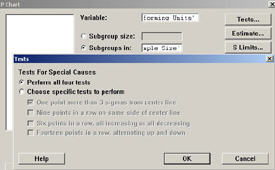 |
6. Run the chart: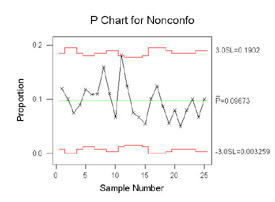 |
As you can see, there are a number of additional steps required to achieve the same result. And, as we know from Lean, extra steps mean additional chance for error and more importantly: delay.
Most people find Minitab's® step 4 confusing. How do I select my data? What column do I select to do what?
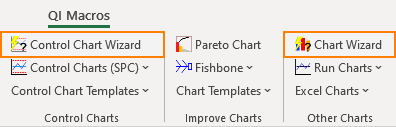
QI Macros Chart Wizards
And the beginning SPC user struggles before they begin with choosing the right chart. That's why the QI Macros have a Chart Wizard and a Control Chart Wizard to choose the right chart automatically. Just select your data and click on the Wizard!
QI Macros Fill-in-the-Blank Templates
Only the QI Macros has Excel templates for each chart. Just drop your data directly into the yellow input area and the chart is created to the right. You don't have to run anything.
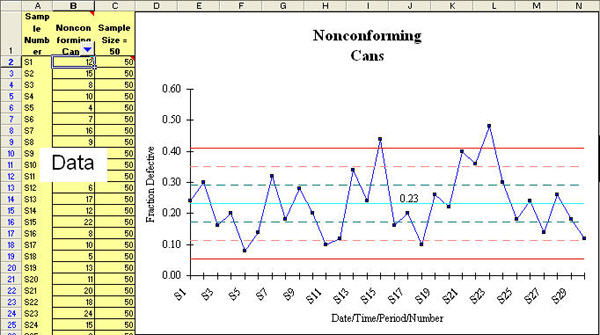
This may be the easiest way to create Excel-based SPC charts that you update every month or week.
But it's up to you. How much money do you have to spend? And how much time and energy do you want to expend creating your charts?
Join 100,000+ Users
in 80 Countries
![]()

KnowWare International, Inc.
2696 S. Colorado Blvd., Ste. 555
Denver, CO 80222 USA
Toll-Free: 1-888-468-1537
Local: (303) 756-9144