Pareto Chart Software Comparison
Compare Pareto Charts Created by Six Sigma Software Packages
A Pareto chart combines a sorted bar graph with a cumulative line graph. The bars should touch and are placed from left to right in descending order. The cumulative line graph should show the percent contribution of all preceding bars.
Unfortunately, Pareto charts created by most six sigma software packages do not meet these requirements and some are not really Pareto charts at all.
Why is QI Macros the ONLY software that produces a proper Pareto Chart?
- Joe DeFeo
Contrast that with a QI Macros Pareto chart which meets all of the requirements and more.
Minitab® Annual License: $1,851
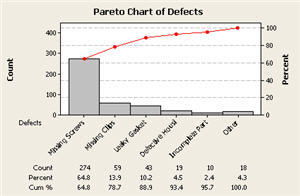
The left axis isn't scaled properly and cumulative line graph doesn't extend through the chart as it should. Cumulative percentages are not shown on the line graph.
QI Macros® - $379 USD
Bars touch; bars over 20% are highlighted with color; axes are scaled correctly; cumulative percentages are shown on the line graph.
SQC Pack® - $1,290
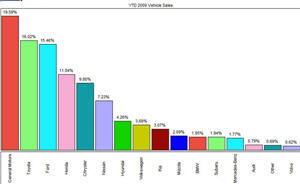
Bars are close but don't touch. There's no cumulative line graph. So this isn't really a Pareto, just a sorted bar chart.
QI Macros®
Bars touch; bars over 20% are highlighted with color; axes are scaled correctly; cumulative percentages are shown on the line graph.
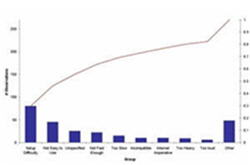
SigmaXL® - $399
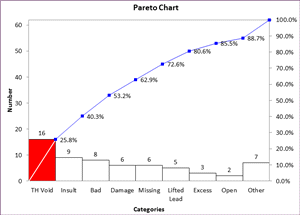
Bars have space between them: left axis isn't scaled properly; and cumulative line graph doesn't extend through the chart as it should. Cumulative percentages are not shown on the line graph.
QI Macros®
Bars touch; bars over 20% are highlighted with color; axes are scaled correctly; cumulative percentages are shown on the line graph.
SPC XL® - $299
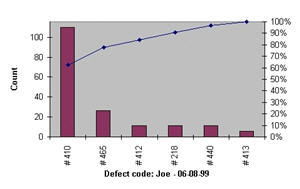
Bars have space between them and cumulative line graph doesn't extend through the chart as it should. Cumulative percentages are not shown on the line graph.QI Macros®
Bars touch; bars over 20% are highlighted with color; axes are scaled correctly; cumulative percentages are shown on the line graph.
QI Macros is also the most affordable six sigma software package and is easiest to use.
I really like QI Macros. The Pareto chart is worth the purchase price of the whole deal.
— Mike Dean, Ellwood Texas Forge
I have purchased your QI Macros and now amaze my friends and co-workers with the ease and speed of my Pareto charts and other stats.
— Bob Miller, Training Manager, SETECH, Inc
