Struggling with Design of Experiments (DOE)?
QI Macros DOE templates for Excel can help,
...even if you don't know anything about DOE!
QI Macros DOE Template
- Click on QI Macros menu > DOE Gage R&R > DOE.
- Conduct tests and enter your data in the template.
- QI Macros does the rest.
What is Design of Experiments?
Design of Experiments (DOE) is a systematic way to determine the best combination of factors in a process to optimize results. A simple example is the ideal combination of time, temperature and pan size when baking a cake. Without DOE, you're stuck with the world's slowest method for success-trial and error.
Design of Experiments, enables you to limit tests to the high (+) and low (-) values for any particular "design factor" (e.g., time, temperature, size, etc.), NOT every increment in between. AND you can test more than one factor at a time.
Required tests are identified and tracked through "orthogonal arrays" and alot of behind the scenes calculations. Fortunately, DOE software like QI Macros DOE templates in Excel can do the heavy lifting for you. All you need to do is run the designated tests and drop in your data.
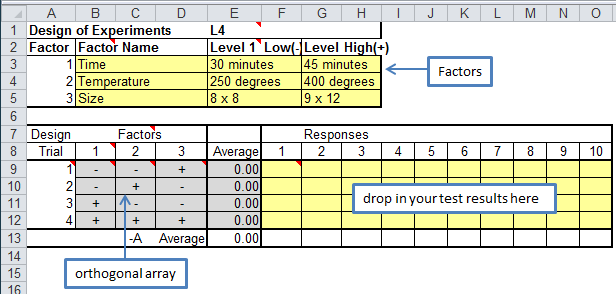
Example of an Orthogonal Array
An orthogonal array is simply the list of the tests you need to run to perform a design of experiments. Below is an example of QI Macros L4 Taguchi template where we are testing three factors. The orthogonal array lists 4 different combinations (trials) to test.
For example, trial 1 is: cell B9 "-" Lowest time (30 min) with cell C9 "-" Lowest temp (250 degrees) with cell D9 "+" Highest pan (9x12). You would conduct this test up to 10 times and record the results in cells F9 to O9. In our cake example, the results would be subjective (rating from 1 to 10 by tasters.) In most manufacturing tests the results would be objectively measured.
What is Confounding?
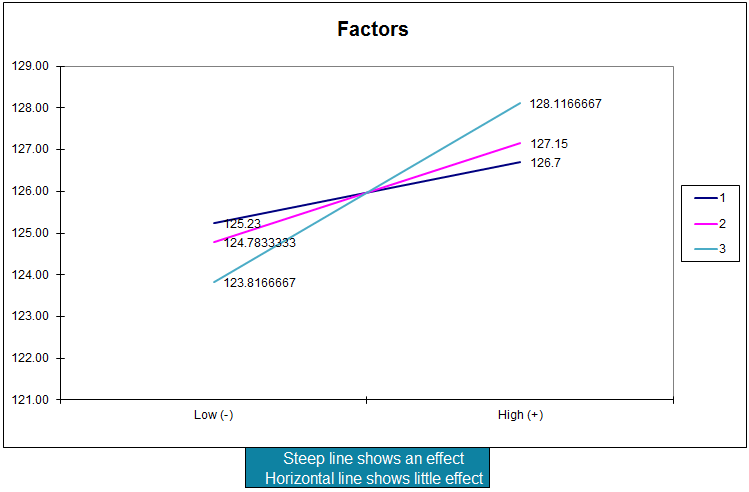
A common DOE term is "confounding," which simply means that one factor affects another. You'd expect a higher temperature to result in a shorter cooking time, and vice versa, but does a square pan take longer than a round one? Using the results of your tests, doe software will draw the interactions between each of the factors as a line graph.
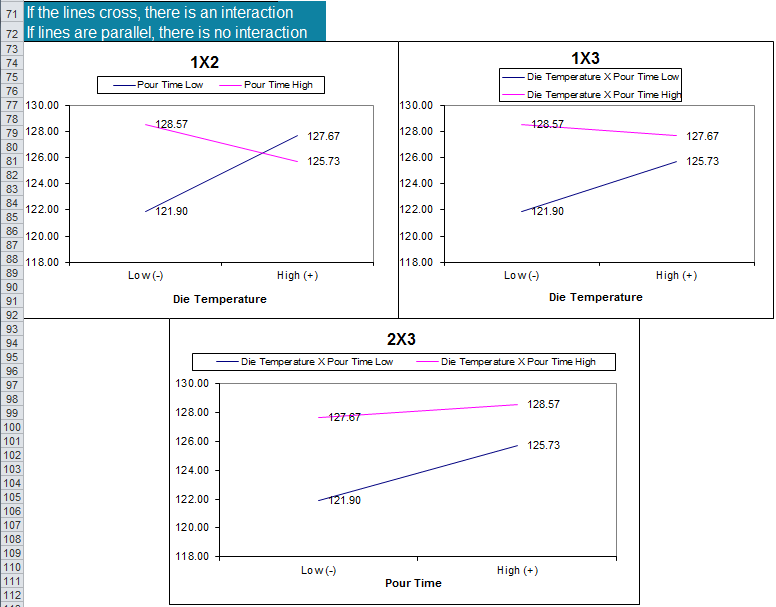
If the two lines are parallel, there's no interaction. Is one end higher than the other? If so, you can immediately tell which value (high/low) gives you the best result.
If the two lines cross, there is an interaction (confounding). And, by looking at where the two lines intersect on the graph, you can determine the optimum settings (e.g., time and temperature to get the best cake).
Examples of charts created by QI Macros DOE Templates
Benefits of Using Design of Experiments
Design of Experiments can help you shorten the time and effort required to discover the optimal conditions to produce Six Sigma quality in your delivered product or service. Don't let the +/- arrays baffle you. Just pick 2, 3, or 4 factors, pick sensible high/low values, and design a set of experiments to determine which factors and settings give the best results.
Start with a 2-factor and work your way up. It's just not that hard, especially with the right software.
