Tips for Using Excel Formulas to Prepare Data for Analysis
Some users of QI Macros miss the opportunity to use Excel's formulas to prepare for charting data and analysis. Here are some Excel formula tips and ways to use Excel to your advantage:
- Calculating Ratios
- Split Text in One Cell to Multiple Cells using Text to Columns
- Time and Date Formulas
- Logic formulas
- Pre-written Excel Formulas in QI Macros
Calculating Ratios in Excel
Most companies need to analyze defects in relationship to overall volume (e.g., repeat calls to a call center, repeat visits to an emergency room for the same problem, returned product, etc.) Calculating ratios in Excel can help. Although p charts and u charts will show this kind of data, it's also acceptable to turn the numbers into a ratio and use an XmR (Individuals and Moving Range) chart.
Most hospitals keep track of patient falls and they report this as falls per thousand patient days. If the data looks like the following, how do you express it as a ratio?
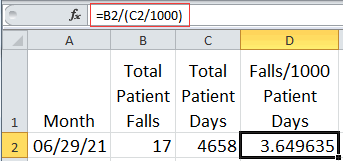
Simply click on the cell to right of the data and enter the formula starting with an equal sign::
=B2/(C2/1000)
Where:
B2 is number of falls
C2 is number of patient days
C2/1000 yields the number of thousand patient days.
Putting the formula in parenthesis tells Excel to do this first, then divide it into B2, otherwise the answer would be incorrect.
This formula could also have been written as:
B2*1000/C2
Then, simply move the mouse over the lower right corner of the cell containing the formula (look for the cursor to change to a plus shape) and double click. Excel will copy the formula down to the last non-blank cell.
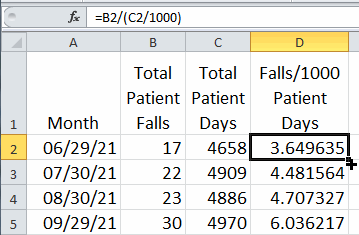
Then just select the labels in column A, hold the ctrl key, and select the ratios in column D to draw an XmR chart using the control chart wizard.
Time and Date Formulas for Excel
Time or Date data is another format that people can tweak to their needs.
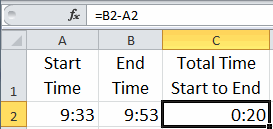
If you want to know the difference between two times (e.g., a start and end time), simply input a formula to subtract one from the other (B2-A2 = elapsed time):
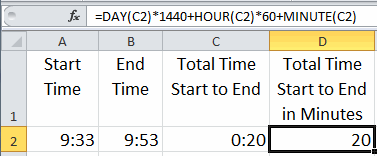
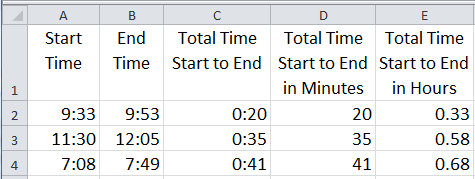
Then, if you want to convert the time or date format into minutes, you will need a formula that converts days, minutes and seconds into a single value. There are 1440 minutes in a day and 60 per hour. DAY, HOUR and MINUTE convert dates or times into a count you can multiply and add to get the result you want. Note: You may also need to format columns D and E to General or Number.
What if we want to convert times or dates into hours? The formula is very similar:
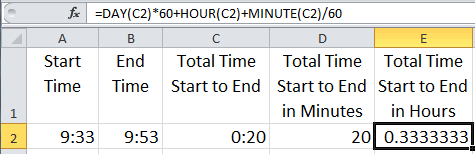
This gives us the elapsed time in various formats that can be easily graphed using QI Macros:
Logic Formulas for Excel
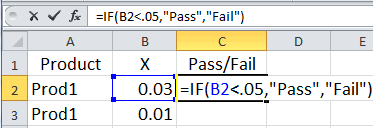
Sometimes we need some IF-THEN-ELSE logic. Recently, a client was trying to figure out how to evaluate a report to show Pass/Fail so that it could be counted with a PivotTable. To do this, we had to add some formulas. In this case, a certain value "X" had to be between two values. The first formula evaluates if Prod1's X value is less than 0.05 and puts the word "Pass" or "Fail" in the Cell:
Of course, this formula won't work for all of the products in the report which have other specification limits:
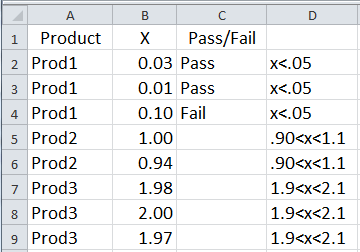
So, we had to expand the formula to check the product name and choose the right limits. The formula for product 2 is highlighted below to help you see the separate parts of the formula.
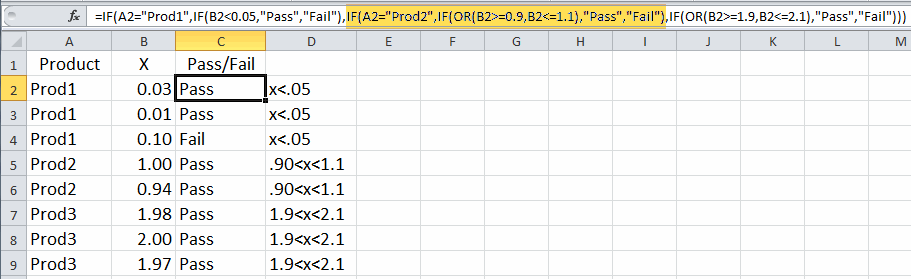
The Pass/Fail results can now be counted easily with a PivotTable.
Excel Will Guide You
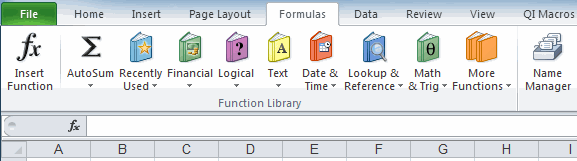
If you don't know what function to use, Excel can show you the way. Simply select an empty cell, click Formulas, then Insert-Function.
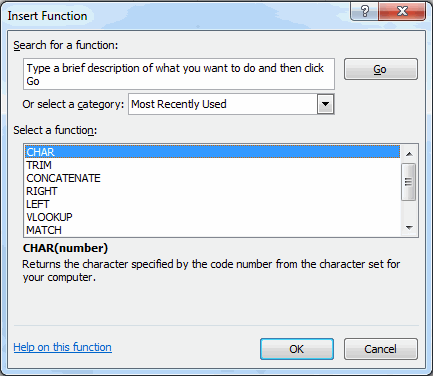
Excel will show you the functions available:
Here's My Point
Sometimes data has to be manipulated to provide the right starting point for analysis. Sometimes you need a simple mathematical formula, sometimes text, sometimes IF-THEN-ELSE logic. Regardless, sometimes you will need a basic grasp of Excel formulas and functions to make your life easier.
Have fun exploring Excel's functions. If you're struggling with how to get the data in a format you want, send me an email with your data and your problem. I can't do all of your work for you, but I can be a short cut to get you started.
Stop using old technology!
Upgrade Your Excel and Data Analysis Skills to Smart Charts Using QI Macros.
Track Data Over Time
Line Graph
Control Chart
Compare Categories
Pie Chart
Pareto Chart
Analyze Variation
Bar or Column Chart
Histogram
QI Macros add-in for Excel makes creating smart charts a snap.
Join 100,000+ Users
in 80 Countries
![]()
