Want to Run Stability Analysis After Adding New Data to a Control Chart Template?
Automate Stability Analysis Using These Instructions
We have found that customers want to run stability analysis using control chart rules every time they add data to a control chart template. That way, every time an operator adds a value to the chart, QI Macros will immediately point out any unstable (out of control) conditions.
The easiest way to do that would be to use Visual Basic Code that will run every time someone adds a new data point. I got this idea from one of our Fortune 500 clients that make food products.
How to Automate Stability Analysis
Our customer was using an XmR chart to analyze production over a 1-3 day period, taking readings every hour. The operator enters the data in column "B" of the worksheet. They would normally have to run Stability Analysis to detect out-of-control conditions, but what if they forget?
Excel has functions that can detect when a cell is changed, so all we have to do is make sure the change is in column B, select the X chart and then call the QI Macros Stability Analysis routine. The code can analyze the R chart as well.
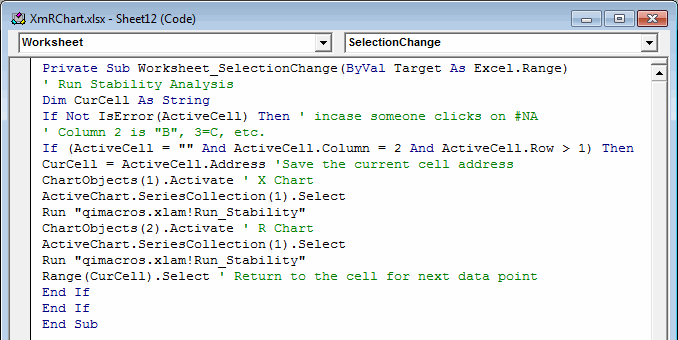
Here's the code:
Private Sub Worksheet_SelectionChange(ByVal Target As Excel.Range)
' Run Stability Analysis
Dim CurCell As String
If Not IsError(ActiveCell) Then ' incase someone clicks on #NA
' Column 2 is "B", 3=C, etc.
If (ActiveCell = "" And ActiveCell.Column = 2 And ActiveCell.Row > 1) Then
CurCell = ActiveCell.Address 'Save the current cell address
ChartObjects(1).Activate ' X Chart
ActiveChart.SeriesCollection(1).Select
Run "qimacros.xlam!Run_Stability"
ChartObjects(2).Activate ' R Chart
ActiveChart.SeriesCollection(1).Select
Run "qimacros.xlam!Run_Stability"
Range(CurCell).Select ' Return to the cell for next data point
End If
End If
End Sub
To Add Code to the Control Chart Template:
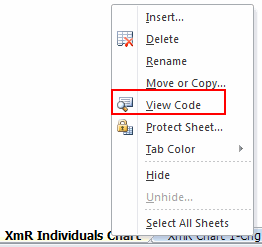
1. Right click on the worksheet name (XmR Individuals Chart) and choose "View Code":
2. Paste the automation code into the worksheet:
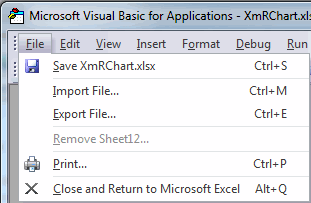
3. Close the VBA project and return to Excel:
4. Save the workbook.
This worksheet will now automatically run Stability Analysis every time a blank cell in column B is changed. It will ensure Stability Analysis is run every time the chart is updated with new data which means that operators can't forget to do it and unstable conditions will be identified immediately.
Pretty slick!
Other Considerations
This needs to be done for every worksheet in a control chart template.
In p or u chart templates, consider using column=3 because you will need a numerator and a denominator to add a point and delete the code to analyze the R chart.
Learn More...
- Control Chart Template options
- Stability Analysis Rules in QI Macros SPC Software
- Control Chart Dashboards
Stop Struggling with Control Charts!
Start creating your Control Charts in just minutes.
Download a free 30-day trial. Get Control Charts now!
QI Macros Draws These Charts Too!
