X Median R Chart Formulas
QI Macros can calculate them for you!
Create an XmedianR Chart using QI Macros
- Select your data.
- Select XmedianR on QI Macros menu.
- QI Macros will do the math and draw the graph for you.
Go Deeper:
The XMedianR Chart works just like the XbarR chart except that it uses the median instead of the average as a measure of central tendency.
XMedianR Chart formulas for the Range and Median charts.
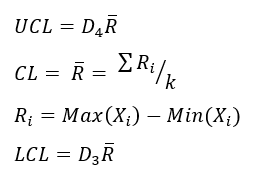
Range Chart Formula
X Median Chart Formula
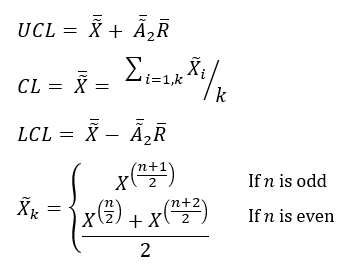
n = number of samples in a subgroup
k = number of subgroups used to determine the average median and range
Conforms with AIAG SPC 2nd Edition
Process: Calculate, plot, and evaluate the range chart first. If it is "out of control," so is the process. If the range chart looks okay, then calculate, plot, and evaluate the X Chart.
Note: There are no known calculations for constants in an XMedianR Chart where n > 100
The XMedianR Chart is just one of the tools included in QI Macros SPC Software for Excel.
Stop Struggling with X Median R Charts!
Start creating your X Median R Charts in just minutes.
Download a free 30-day trial. Get X Median R Charts now!
Why Choose QI Macros Over Other Control Chart Software?
![]()
Fast and Easy to Use
- Works right in Excel
- Create charts in seconds
- Easy to customize & share charts
- Free Training Anytime
![]()
Proven and Trusted
- More than 100,000 users
- In More than 80 countries
- Five Star CNET Rating - Virus free
![]()
Affordable
- Only $369 USD
Quantity Discounts Available - No annual subscription fees
- Free technical support
