XbarS Chart Formulas
QI Macros can calculate them for you!
Create an XbarS Chart using QI Macros
- Select your data.
- Select the chart on QI Macros menu.
- QI Macros will do the math and draw the graph for you.
Go Deeper:
The XbarS Chart can help you evaluate the stability of processes using variable data--time, cost, length, weight when you have 6 or more samples per period.
XbarS Chart formulas used in QI Macros SPC add-in for Excel
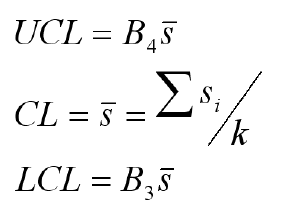
XbarS Standard Deviation Chart Formula
Average (Xbar) Chart Formula
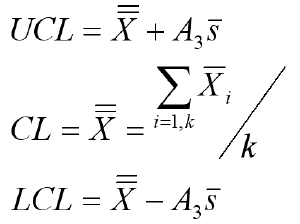
k = number of subgroups (a group of measurements produced under the same set of conditions)
n = number of samples in a subgroup
A3, B3 and B4 are constants based on n
Conforms with ANSI/ASQC B1, B2, B3 1996
Process: Calculate, plot, and evaluate the Range Chart first. If it is "out of control," so is the process. If the Range Chart looks okay, then calculate, plot, and evaluate the X Chart.
Note: Some people wonder why QI Macros results are a tiny bit different from some versions other software. The answer is that they use a different estimator. Donald Wheeler in Advanced Topics in Statistical Process Control says: "Even though the Pooled [Standard Deviation] estimator is common in many applications, the robustness of Rbar/d2 and Sbar/c4 makes them the preferred estimators for use with process behavior charts."
Furthermore, Minitab started using Pooled Standard Deviation to calculate Cp/Cpk, and control limits on XbarR and XbarS Charts in versions 15 and 16. Minitab 17 went back to Rbar/d2 and Sbar/c4 for XbarR/S control limits, but retained pooled stdev for Cp/Cpk calculations when using multiple samples.
Learn More...
- Create a XbarS Chart in Excel using QI Macros
- XbarS Chart Video
- XbarS Capability Suite Template in Excel
The X bar S chart is just one of the tools included in QI Macros SPC Software for Excel.
Stop Struggling with XbarS Charts!
Start creating your XbarS Charts in just minutes.
Download a free 30-day trial. Get XbarS Charts now!
Why Choose QI Macros Over Other Control Chart Software?
![]()
Fast and Easy to Use
- Works right in Excel
- Create charts in seconds
- Easy to customize & share charts
- Free Training Anytime
![]()
Proven and Trusted
- More than 100,000 users
- In More than 80 countries
- Five Star CNET Rating - Virus free
![]()
Affordable
- Only $369 USD
Quantity Discounts Available - No annual subscription fees
- Free technical support
