Six Sigma  -  I-MR-R Control Chart

home · products · services · search · view cart · contact  
       
      Analyze Variation with a I-MR-R Control Chart in Excel
   

KnowWare
2253 S. Oneida 3D
Denver, CO 80224

888-468-1537
303-756-9144
Jay Arthur

Copyright © 2010


Additional Process Analysis Videos and Information
I-MR-R Control Chart Article XmR Trend Control Chart Video
Cusum Control Chart Video EWMA Control Chart Video
XmedianR Control Chart Video Moving Average Control Chart Video

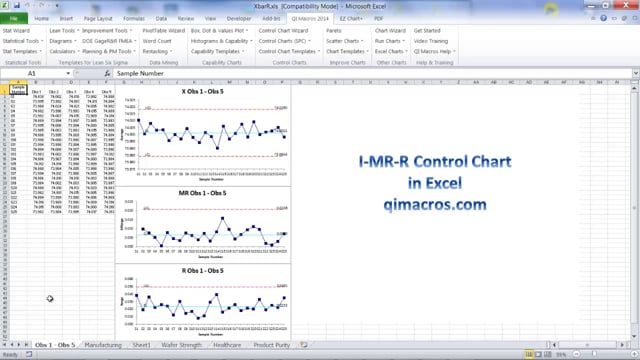
This video shows how to analyze variation within and between subgroups using an I-MR-R Control Chart in Excel 2007-2010 with the QI Macros.

Try QI Macros
FREE
For 30-Days


Or Buy It Now!

Lean Six Sigma Demystified


      home | products | search | sitemap | view cart | contact